
Newmont Reports 2025 Mineral Reserves of 118.2 Million Gold Ounces and 12.5 Million Tonnes of Copper
19.2.2026 22:08:00 CET | Business Wire | Press release
Newmont Corporation (NYSE: NEM, ASX: NGT, PNGX: NEM) (Newmont or the Company) reported gold Mineral Reserves ("reserves") of 118.2 million attributable ounces at the end of 2025 compared to 134.1 million attributable ounces at the end of 2024, mainly driven by the divestment of assets in 2025. Newmont's portfolio includes significant reserves from other metals, including 12.5 million attributable tonnes of copper reserves and 442 million attributable ounces of silver reserves.
This press release features multimedia. View the full release here: https://www.businesswire.com/news/home/20260219894602/en/
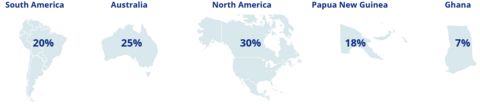
Percentage of Gold Reserves by Jurisdiction
"In 2025, Newmont maintained its position of having the industry's largest gold reserve base, declaring 118 million ounces of reserves, representing decades of production life with meaningful upside," said Natascha Viljoen, Newmont's President and Chief Executive Officer. "Through the disciplined application of technical rigor in our leading exploration program, we remain focused on extending mine life, discovering new opportunities, and unlocking value across our world-class portfolio of operations and projects."
2025 Reserves & Resources Highlights
- The gold industry's largest reserve base with 118.2 million attributable ounces1
- Changes since 2024 are mainly driven by divestments (8.6 million ounces), followed by depletion from mining, reclassification of the Yanacocha Sulfides project reserves to resources, and cost escalation assumptions, offset by an increased gold price assumption, resource conversion and other positive revisions at Brucejack, Tanami, Lihir, Ahafo North and Ahafo South
- Gold reserves are determined based on a gold price of $2,000 per ounce following the annual pricing review, more than 20 percent below the three-year trailing average price and well below the current spot price
- Newmont benefits from a premier operating asset base with gold reserve life of ten years or more at Lihir, Cadia, Tanami, Boddington, Ahafo North, Merian, Cerro Negro, Brucejack, Nevada Gold Mines (NGM), and Pueblo Viejo further enhanced by a broader portfolio and organic project pipeline
- Measured & Indicated Gold Mineral Resources2 of 88.1 million attributable ounces and Inferred Resources of 60.6 million attributable ounces, determined based on a gold price of $2,300 per ounce
- Significant exposure to other metals including 12.5 million attributable tonnes of copper reserves, 13.1 million attributable tonnes of Measured & Indicated copper resources and 5.6 million attributable tonnes of Inferred copper resources, along with 442 million ounces of silver reserves, 508 million ounces of Measured & Indicated silver resources and 126 million ounces of Inferred silver resources
- Additional exposure to other metals including lead, zinc and molybdenum
| _______________________________________________ | ||
1 | Compared to 2024 reserves disclosed by gold mining companies in 2025 | |
2 | Exclusive of Mineral Reserves | |
Percentage of Gold Reserves by Jurisdiction
Newmont’s reserve base is a key differentiator with an operating reserve life of more than ten years at eight managed sites and two non-managed joint ventures, anchored in favorable mining jurisdictions along with significant upside potential from a robust organic project pipeline.
PROVEN & PROBABLE GOLD RESERVES
For 2025, Newmont reported 118.2 million attributable ounces of gold reserves compared to the prior year total of 134.1 million attributable ounces. Divestment of assets accounted for 8.6 million ounces of this reduction3, followed by depletion from mining of 7.2 million ounces, net negative revisions of 5.6 million ounces (primarily from Yanacocha Sulfides reclassified to resource) and cost escalation assumption impacts of 3.1 million ounces, offset by increases from price related revisions of 6.6 million ounces, as well as the addition of 2.0 million ounces from conversion of resources and other additions primarily at Brucejack (+0.7 million ounces) and Lihir (+0.5 million ounces).
| _____________________________________________ | ||
3 | Assets divested in 2025 were CC&V, United States; Musselwhite, Canada; Porcupine, Canada; Éléonore, Canada; and Akyem, Ghana. | |
Managed Assets
- Brucejack reserves increased 1.0 million ounces to 2.9 million ounces, primarily due to conversion of resources of 0.7 million, positive net revisions of 0.3 million following favorable drilling results and a favorable price impact of 0.2 million ounces net of cost escalation assumptions, offsetting depletion of 0.2 million ounces
- Merian reserves increased 0.4 million ounces to 4.5 million ounces, primarily due to favorable price related revisions of 0.8 million ounces, more than offsetting negative net revisions of 0.2 million ounces and depletion of 0.2 million ounces
- Lihir reserves increased 0.2 million ounces to 16.0 million ounces, primarily due to favorable price impacts of 0.8 million ounces and conversion from resources through infill drilling of 0.5 million ounces, partially offset by net negative revisions of 0.3 million ounces offsetting depletion of 0.8 million ounces
- Tanami reserves increased 0.2 million ounces to 5.3 million ounces, primarily due to favorable price impacts, net of cost escalation of 0.3 million ounces, additions from net positive revisions of 0.2 million ounces and resource conversion from infill drilling of 0.1 million ounces, more than offsetting depletion of 0.4 million ounces
- Ahafo North reserves increased 0.1 million ounces to 4.7 million ounces, primarily due to additions from resources through updated mine designs of 0.2 million ounces, partially offset by depletion of 0.1 million ounces
- Red Chris reserves decreased 0.1 million ounces to 3.6 million ounces, primarily due to depletion of 0.1 million ounces
- Cerro Negro reserves decreased 0.2 million ounces to 3.0 million ounces, primarily due to depletion of 0.2 million ounces and negative net revisions of 0.1 million ounces, partially offset by 0.1 million ounces of conversions from resources with infill drilling
- Ahafo South reserves decreased 0.5 million ounces to 4.1 million ounces, primarily due to the depletion of 0.8 million ounces, partially offset by 0.2 million ounces added at the Apensu South open pit and positive price impacts of 0.1 million ounces
- Boddington reserves decreased 0.6 million ounces to 10.2 million ounces, primarily due to depletion of 0.6 million ounces and negative net revisions of 0.1 million ounces, partially offset by favorable price related revisions 0.1 million ounces net of cost escalation assumptions
- Cadia reserves decreased 0.6 million ounces to 13.5 million ounces, primarily due to depletion of 0.5 million ounces
- Peñasquito reserves decreased 0.9 million ounces to 3.2 million ounces, primarily due to depletion of 0.8 million ounces along with negative net revisions from a block model update of 0.2 million ounces partially offset by favorable price impact of 0.1 million ounces
- Yanacocha reserves decreased 4.8 million ounces to 0.5 million ounces, primarily due to the reclassification of 4.5 million ounces of reserves relating to the Yanacocha Sulfides project to resources, allowing Newmont to prioritize other opportunities at site and continue advancing closure activities in non-operating areas
Non-Managed Assets
- Newmont’s 38.5 percent interest in Nevada Gold Mines represented 17.4 million attributable ounces of gold reserves at year end, compared to 17.9 million ounces at the end of 2024
- Newmont's 40 percent interest in Pueblo Viejo represented 8.2 million attributable ounces of gold reserves at year end with no change from 2024
Newmont's gold grade reserve remained unchanged at 0.94 grams per tonne year over year when adjusted for the divested assets.
GOLD RESOURCES45
At the end of 2025, Newmont reported Measured and Indicated Gold Mineral Resources of 88.1 million attributable ounces, an 11 percent decrease from the prior year total of 99.4 million attributable ounces. Inferred Gold Mineral Resources totaled 60.6 million attributable ounces, a 14 percent decrease from the prior year total of 70.6 million attributable ounces. The main driver of lower resources is 14.6 million ounces removed from assets divested in 20256, together with net negative revisions, net resource conversions to reserves, and updated cost assumptions; partially offset by the resource increases from price assumption related revisions, as well as additions.
Notable Changes7
- Cadia resources decreased by 8.5 million ounces (44 percent) to 11.0 million ounces, primarily driven by 5.7 million ounces of net negative revisions related to a geotechnical standoff from the in-pit tailings facility as well as block model updates and changes to inferred resource classifications as a consequence of an updated drill spacing study. An additional 3.0 million ounces of negative impact from higher cost expectations for future caves net of benefits from higher price assumptions
- Namosi resources of 5.0 million ounces were removed from resources as Newmont further evaluates the project
- Yanacocha resources increased by 4.3 million ounces, primarily driven by 4.5 million ounces reclassified from reserves from Yanacocha Sulfides, aligned with Newmont's decision to indefinitely defer the project
- Ahafo South resources increased 45 percent to 7.4 million ounces, primarily driven by 1.7 million ounces of resource additions largely at Apensu underground
Newmont’s Measured and Indicated Gold Mineral Resource grade decreased to 0.58 grams per tonne compared to 0.59 grams per tonne in the prior year. Inferred Gold Mineral Resource increased to 0.9 grams per tonne compared to 0.6 grams per tonne in the prior year, largely due to the removal of inferred resources from Namosi and assets divested.
| _______________________________________ | ||
4 | Total resources presented includes Measured and Indicated resources of 88.1 million attributable gold ounces and Inferred resources of 60.6 million attributable gold ounces. See cautionary statement at the end of this release. | |
5 | Net Conversion inclusive of ounces reclassified from reserves to resources. | |
6 | Assets divested in 2025 were CC&V, United States; Musselwhite, Canada; Porcupine, Canada; Éléonore, Canada; and Akyem, Ghana. | |
7 | Includes Measured and Indicated as well as Inferred resources. See detailed tables that follow. | |
OTHER METALS
Copper reserves decreased slightly to 12.5 million tonnes from 13.5 million tonnes in the prior year, primarily due to reclassification of the Yanacocha Sulfides project to resources. Measured and Indicated copper resources decreased to 13.1 million tonnes from 14.1 million tonnes. Inferred copper resources decreased to 5.6 million tonnes from 11.0 million tonnes driven almost entirely by the removal of Namosi.
Silver reserves decreased to 442 million ounces compared to 530 million ounces in the prior year, primarily due to the reclassification of the Yanacocha Sulfides project to resources and depletion at Peñasquito. Measured and Indicated silver resources increased to 508 million ounces from 469 million ounces in the prior year while inferred silver resources increased to 126 million ounces from 113 million ounces in the prior year; both due to the reclassification of the Yanacocha Sulfides projects.
Lead reserves decreased slightly to 0.7 million tonnes from 0.8 million tonnes primarily due to depletion. Measured and Indicated lead resources were unchanged at 0.5 million tonnes. Zinc reserves decreased to 1.5 million tonnes from 1.7 million tonnes primarily due to depletion. Measured and Indicated zinc resources increased to 1.4 million tonnes from 1.2 million tonnes.
Molybdenum reserves were unchanged at 0.2 million tonnes. Measured and Indicated molybdenum resources remained unchanged at 0.1 million tonnes.
EXPLORATION OUTLOOK
Newmont’s attributable exploration expenditure for managed operations is expected to be approximately $205 million in 2026 with 80 percent of total exploration investment dedicated to near-mine expansion programs and brownfields with the remaining 20 percent allocated to the advancement of greenfield projects.
Additionally, Newmont’s share of exploration investment for its non-managed operations is expected to be approximately $35 million, for a total consolidated exploration expense outlook of $240 million for 2026.
Newmont expects to invest the largest proportion of exploration funds in prospective targets at Merian, Cerro Negro, and Ahafo South.
UPDATED GOLD PRICE FOR MINERAL RESERVES AND MINERAL RESOURCES
As part of the annual Mineral Reserves and Mineral Resources update, Newmont assesses the metal price assumptions used for the calculation of year-end reserves and resources.
In line with market conditions, Newmont has increased its reserves gold price assumption by 18 percent to $2,000 per ounce from $1,700 per ounce in 2024; which is less than 60 percent of the 2025 average realized gold price. Newmont's updated reserves gold price is approximately 23 percent lower than the three-year trailing gold price average of $2,586 per ounce. Historically, over the last ten years (2015 - 2024), Newmont has assumed a reserve price approximately 13 percent below the three year trailing average. Consistent with Newmont's historical approach, the resources gold price has been calibrated higher than reserves to allow identification of the optimum areas to further expand the life of its assets and to target where additional drilling and study work is required at its operating mines. For 2025, mineral resources are based on a $2,300 per ounce.
Newmont's robust internal processes and proven track record of responsibly and rigorously defining reserves and resources will continue to support the development of its world-class portfolio and organic project pipeline.
GOLD RESERVE SENSITIVITY
A $100 increase in gold price would result in an approximate 5 percent increase in gold reserves while a $100 decrease in gold price would result in an approximate 2 percent decrease in gold reserves. These sensitivities assume an oil price of $75 per barrel (WTI), Australian dollar exchange rate of $0.70 and Canadian dollar exchange rate of $0.75. These sensitivities assume all other inputs remain equal, including all cost and capital assumptions, which may also have a material impact on these approximate estimates.
KEY RESERVE AND RESOURCE ASSUMPTIONS8 | ||
| At December 31, | |
| 2025 | 2024 |
Gold Reserves ($/oz) | $2,000 | $1,700 |
Gold Resources ($/oz) | $2,300 | $2,000 |
Copper Reserves ($/lb) | $3.75 | $3.50 |
Copper Resources ($/lb) | $4.25 | $4.00 |
Silver Reserves ($/oz) | $25.00 | $20.00 |
Silver Resources ($/oz) | $28.00 | $23.00 |
Lead Reserves ($/lb) | $0.90 | $0.90 |
Lead Resources ($/lb) | $1.00 | $1.00 |
Zinc Reserves ($/lb) | $1.20 | $1.20 |
Zinc Resources ($/lb) | $1.30 | $1.30 |
Molybdenum Reserves ($/lb) | $13.00 | $13.00 |
Molybdenum Resources ($/lb) | $16.00 | $16.00 |
Australian Dollar (A$:US$) | $0.70 | $0.70 |
Canadian Dollar (C$:US$) | $0.75 | $0.75 |
West Texas Intermediate ($/bbl) | $75.00 | $75.00 |
For additional details on Newmont’s reported gold, copper, silver, lead, zinc, and molybdenum Mineral Reserves and Mineral Resources, please refer to the tables at the end of this release.
| _____________________________________________________ | ||
8 | For 2025 and 2024, Newmont reserves and resources were estimated using the price assumptions noted, except for certain sites as detailed in the footnotes of the reserves and resources tables below. | |
RESERVE AND RESOURCE TABLES
Proven and probable reserves are based on extensive drilling, sampling, mine modeling and metallurgical testing from which Newmont determined economic feasibility. The reference point for mineral reserves is the point of delivery to the process plant. Metal price assumptions, adjusted for Newmont's exchange rate assumption, are based on considering such factors as market forecasts, industry consensus and management estimates. The price sensitivity of reserves depends upon several factors including grade, metallurgical recovery, operating cost, waste-to-ore ratio and ore type. Metallurgical recovery rates vary depending on the metallurgical properties of each deposit and the production process used. The reserve tables below list the average estimated in-situ metallurgical recovery rate for each deposit, which takes into account the relevant processing methods. The cut-off grade, or lowest grade of mineralization considered economic to process, varies between deposits depending upon prevailing economic conditions, mineability of the deposit, by-products, amenability of the ore to gold, copper, silver, lead, zinc or molybdenum extraction and type of milling or leaching facilities available. Reserve estimates may have non-material differences in comparison to our joint venture partners due to differences in classification and rounding methodology.
The proven and probable reserve figures presented herein are estimates based on information available at the time of calculation. No assurance can be given that the indicated levels of recovery of gold, copper, silver, lead, zinc and molybdenum will be realized. Ounces of gold or silver or tonnes of copper, lead, zinc or molybdenum included in the proven and probable reserves are those contained prior to losses during metallurgical treatment. Reserve estimates may require revision based on actual production. Market fluctuations in the price of gold, copper, silver, lead, zinc and molybdenum, as well as increased production costs or reduced metallurgical recovery rates, could render certain proven and probable reserves containing higher cost reserves uneconomic to exploit and might result in a reduction of reserves.
The measured, indicated, and inferred resource figures presented herein are estimates based on information available at the time of calculation and are exclusive of reserves. A “mineral resource” is a concentration or occurrence of solid material of economic interest in or on the Earth’s crust in such form, grade, or quality and quantity that there are reasonable prospects for eventual economic extraction. The location, quantity, grade or quality, continuity and other geological characteristics of a mineral resource are known, estimated or interpreted from specific geological evidence and knowledge, including sampling. The reference point for mineral resources is in situ. Mineral resources are sub-divided, in order of increasing geological confidence, into inferred, indicated and measured categories. Ounces of gold and silver or tonnes of copper, zinc, lead and molybdenum included in the measured, indicated and inferred resources are those contained prior to losses during metallurgical treatment. The terms "measured resource," "indicated resource," and "inferred resource" mean that part of a mineral resource for which quantity and grade or quality are estimated on the basis of geological evidence and sampling that is considered to be comprehensive, adequate, or limited, respectively. Market fluctuations in the price of gold, silver, copper, zinc, lead and molybdenum as well as increased production costs or reduced metallurgical recovery rates, could change future estimates of resources.
Newmont publishes reserves annually, and will recalculate reserves at December 31, 2026, taking into account metal prices, changes, if any, to future production and capital costs, divestments and conversion to reserves, as well as any acquisitions and additions during 2026.
Please refer to the reserves and resources cautionary statement at the end of the release.
Gold Reserves (1) | ||||||||||||||||||||||||||||||
December 31, 2025 | December 31, 2024 | |||||||||||||||||||||||||||||
|
| Proven Reserves | Probable Reserves | Proven and Probable Reserves |
| Proven and Probable Reserves | ||||||||||||||||||||||||
Deposits/Districts | Newmont Share | Tonnage (2) (000 tonnes) | Grade (g/tonne) | Ounces (3) (000) | Tonnage (2) (000 tonnes) | Grade (g/tonne) | Ounces (3) (000) | Tonnage (2) (000 tonnes) | Grade (g/tonne) | Ounces (3) (000) | Metallurgical Recovery (3) | Tonnage (2) (000 tonnes) | Grade (g/tonne) | Ounces (3) (000) | ||||||||||||||||
Lihir Open Pits | 100 | % | — | — | — | 147,900 | 2.55 | 12,100 | 147,900 | 2.55 | 12,100 | 76 | % | 125,900 | 2.86 | 11,600 | ||||||||||||||
Lihir Stockpiles (4) | 100 | % | — | — | — | 72,300 | 1.65 | 3,800 | 72,300 | 1.65 | 3,800 | 76 | % | 77,100 | 1.68 | 4,200 | ||||||||||||||
Total Lihir, Papua New Guinea (5) | 100 | % | — | — | — | 220,200 | 2.26 | 16,000 | 220,200 | 2.26 | 16,000 | 76 | % | 203,000 | 2.41 | 15,800 | ||||||||||||||
Wafi-Golpu, Papua New Guinea (6)(7) | 50 | % | — | — | — | 194,500 | 0.82 | 5,100 | 194,500 | 0.82 | 5,100 | 68 | % | 194,500 | 0.82 | 5,100 | ||||||||||||||
Cadia, Australia (8) | 100 | % | — | — | — | 1,007,600 | 0.42 | 13,500 | 1,007,600 | 0.42 | 13,500 | 81 | % | 1,051,800 | 0.42 | 14,100 | ||||||||||||||
Tanami, Australia | 100 | % | 10,100 | 4.88 | 1,600 | 22,700 | 5.10 | 3,700 | 32,800 | 5.03 | 5,300 | 98 | % | 29,900 | 5.27 | 5,100 | ||||||||||||||
Boddington Open Pit | 100 | % | 265,300 | 0.62 | 5,300 | 216,300 | 0.58 | 4,100 | 481,700 | 0.60 | 9,300 | 85 | % | 495,700 | 0.62 | 9,900 | ||||||||||||||
Boddington Stockpiles (4) | 100 | % | 5,600 | 0.56 | 100 | 57,800 | 0.43 | 800 | 63,400 | 0.44 | 900 | 84 | % | 64,100 | 0.43 | 900 | ||||||||||||||
Total Boddington, Australia (9) | 100 | % | 271,000 | 0.61 | 5,400 | 274,100 | 0.55 | 4,900 | 545,100 | 0.58 | 10,200 | 85 | % | 559,800 | 0.60 | 10,800 | ||||||||||||||
Ahafo South Open Pit (10) | 100 | % | 2,500 | 1.16 | 100 | 40,900 | 1.48 | 1,900 | 43,400 | 1.46 | 2,000 | 88 | % | 42,000 | 1.63 | 2,200 | ||||||||||||||
Ahafo South Underground (11) | 100 | % | 9,400 | 2.51 | 800 | 10,000 | 2.23 | 700 | 19,400 | 2.37 | 1,500 | 94 | % | 21,300 | 2.54 | 1,700 | ||||||||||||||
Ahafo South Stockpiles (4)(12) | 100 | % | 18,500 | 0.94 | 600 | — | — | — | 18,500 | 0.94 | 600 | 91 | % | 21,700 | 0.97 | 700 | ||||||||||||||
Total Ahafo South, Ghana | 100 | % | 30,400 | 1.44 | 1,400 | 50,900 | 1.63 | 2,700 | 81,300 | 1.56 | 4,100 | 91 | % | 85,000 | 1.69 | 4,600 | ||||||||||||||
Ahafo North, Ghana (13) | 100 | % | — | — | — | 65,500 | 2.23 | 4,700 | 65,500 | 2.23 | 4,700 | 89 | % | 62,000 | 2.32 | 4,600 | ||||||||||||||
Total Ahafo Complex, Ghana | 100 | % | 30,400 | 1.44 | 1,400 | 116,500 | 1.97 | 7,400 | 146,900 | 1.86 | 8,800 | 90 | % | 147,000 | 1.96 | 9,200 | ||||||||||||||
Merian, Suriname | 75 | % | 24,800 | 1.21 | 1,000 | 104,600 | 1.06 | 3,600 | 129,400 | 1.09 | 4,500 | 93 | % | 110,700 | 1.16 | 4,100 | ||||||||||||||
Cerro Negro, Argentina | 100 | % | 2,200 | 11.20 | 800 | 6,800 | 10.38 | 2,300 | 9,000 | 10.58 | 3,000 | 94 | % | 9,300 | 10.82 | 3,200 | ||||||||||||||
Pueblo Viejo Open Pit | 40 | % | 35,800 | 2.22 | 2,600 | 51,300 | 1.95 | 3,200 | 87,100 | 2.06 | 5,800 | 81 | % | 81,700 | 2.13 | 5,600 | ||||||||||||||
Pueblo Viejo Stockpiles (4) | 40 | % | — | — | — | 36,900 | 2.04 | 2,400 | 36,900 | 2.04 | 2,400 | 81 | % | 38,800 | 2.07 | 2,600 | ||||||||||||||
Total Pueblo Viejo, Dominican Republic (7)(14) | 40 | % | 35,800 | 2.22 | 2,600 | 88,200 | 1.99 | 5,600 | 123,900 | 2.06 | 8,200 | 81 | % | 120,500 | 2.11 | 8,200 | ||||||||||||||
NuevaUnión, Chile (7)(15) | 50 | % | — | — | — | 341,100 | 0.47 | 5,100 | 341,100 | 0.47 | 5,100 | 66 | % | 341,100 | 0.47 | 5,100 | ||||||||||||||
Norte Abierto, Chile (7)(16) | 50 | % | — | — | — | 521,100 | 0.65 | 10,800 | 521,100 | 0.65 | 10,800 | 86 | % | 598,800 | 0.60 | 11,600 | ||||||||||||||
Yanacocha, Peru | 100 | % | 18,800 | 0.81 | 500 | — | — | — | 18,800 | 0.81 | 500 | 71 | % | 126,400 | 1.31 | 5,300 | ||||||||||||||
Peñasquito Open Pits | 100 | % | 79,500 | 0.54 | 1,400 | 114,800 | 0.44 | 1,600 | 194,300 | 0.48 | 3,000 | 62 | % | 224,700 | 0.52 | 3,800 | ||||||||||||||
Peñasquito Stockpiles (4) | 100 | % | 4,900 | 0.44 | 100 | 21,800 | 0.21 | 100 | 26,700 | 0.25 | 200 | 45 | % | 32,000 | 0.26 | 300 | ||||||||||||||
Total Peñasquito, Mexico | 100 | % | 84,400 | 0.53 | 1,400 | 136,600 | 0.40 | 1,800 | 221,000 | 0.45 | 3,200 | 61 | % | 256,600 | 0.49 | 4,100 | ||||||||||||||
Red Chris, Canada (17) | 70 | % | 2,600 | 0.32 | — | 178,900 | 0.63 | 3,600 | 181,500 | 0.62 | 3,600 | 69 | % | 186,400 | 0.62 | 3,700 | ||||||||||||||
Brucejack, Canada | 100 | % | — | — | — | 13,500 | 6.65 | 2,900 | 13,500 | 6.65 | 2,900 | 96 | % | 8,600 | 6.95 | 1,900 | ||||||||||||||
NGM Open Pit (18) | 38.5 | % | — | — | — | 131,100 | 1.02 | 4,300 | 131,100 | 1.02 | 4,300 | 75 | % | 124,200 | 1.16 | 4,600 | ||||||||||||||
NGM Stockpiles (4)(19) | 38.5 | % | 6,800 | 1.29 | 300 | 20,800 | 2.35 | 1,600 | 27,600 | 2.09 | 1,800 | 67 | % | 29,200 | 2.08 | 2,000 | ||||||||||||||
NGM Underground (20) | 38.5 | % | 4,200 | 11.67 | 1,600 | 37,900 | 7.93 | 9,700 | 42,100 | 8.30 | 11,200 | 84 | % | 43,700 | 8.06 | 11,300 | ||||||||||||||
Total NGM, United States (21) | 38.5 | % | 10,900 | 5.24 | 1,800 | 189,800 | 2.54 | 15,500 | 200,700 | 2.69 | 17,400 | 80 | % | 197,100 | 2.82 | 17,900 | ||||||||||||||
Divested (22) |
|
|
|
|
|
|
|
|
|
|
|
|
|
| ||||||||||||||||
CC&V Open Pit |
|
|
|
|
|
|
|
|
|
|
| 115,600 | 0.43 | 1,600 | ||||||||||||||||
CC&V Leach Pads (23) |
|
|
|
|
|
|
|
|
|
|
| 34,600 | 0.73 | 800 | ||||||||||||||||
Total CC&V, United States |
|
|
|
|
|
|
|
|
|
|
| 150,200 | 0.50 | 2,400 | ||||||||||||||||
Musselwhite, Canada |
|
|
|
|
|
|
|
|
|
|
| 7,400 | 6.43 | 1,500 | ||||||||||||||||
Porcupine Underground |
|
|
|
|
|
|
|
|
|
|
| 4,400 | 6.46 | 900 | ||||||||||||||||
Porcupine Open Pit |
|
|
|
|
|
|
|
|
|
|
| 30,600 | 1.46 | 1,500 | ||||||||||||||||
Total Porcupine, Canada |
|
|
|
|
|
|
|
|
|
|
| 34,900 | 2.09 | 2,300 | ||||||||||||||||
Éléonore, Canada |
|
|
|
|
|
|
|
|
|
|
| 10,100 | 5.05 | 1,600 | ||||||||||||||||
Akyem Open Pit |
|
|
|
|
|
|
|
|
|
|
| 18,200 | 1.54 | 900 | ||||||||||||||||
Akyem Stockpiles (4) |
|
|
|
|
|
|
|
|
|
|
| 700 | 0.72 | — | ||||||||||||||||
Total Akyem, Ghana |
|
|
|
|
|
|
|
|
|
|
| 19,000 | 1.51 | 900 | ||||||||||||||||
Total Gold |
| 490,900 | 1.04 | 16,500 | 3,416,100 | 0.93 | 101,800 | 3,907,000 | 0.94 | 118,200 | 81 | % | 4,363,000 | 0.96 | 134,100 | |||||||||||||||
____________________________ | ||
(1) | At December 31, 2025 and 2024, gold reserves at sites for which Newmont is the operator were estimated at a gold price of $2,000 and $1,700 per ounce, respectively, unless otherwise noted. Reserves provided by other operators may use pricing that differs. Amounts presented may not recalculate in total due to rounding. | |
(2) | Tonnages include allowances for losses resulting from mining methods. Tonnages are rounded to the nearest 100,000. | |
(3) | Ounces are estimates of metal contained in ore tonnages and do not include allowances for processing losses. Metallurgical recovery rates represent the estimated amount of metal to be recovered through metallurgical extraction processes. Ounces may not recalculate as they are rounded to the nearest 100,000. | |
(4) | Stockpiles are comprised primarily of material that has been set aside to allow processing of higher grade material in the mills. Stockpiles increase or decrease depending on current mine plans. Stockpile reserves are reported separately where ounces exceed 100,000 and are greater than 5% of the total site-reported reserves. | |
(5) | Cut-off grade utilized in 2025 reserves not less than 1.00 gram per tonne. | |
(6) | Project is currently undeveloped. Gold reserves at December 31, 2025 were estimated at a gold price of $1,200 per ounce. | |
(7) | Included in the non-operating segment Corporate and Other in Note 4 to the Consolidated Financial Statements. | |
(8) | The net smelter return value utilized in 2025 reserves not less than $24.62 per tonne. | |
(9) | The net smelter return value utilized in 2025 reserves not less than $18.24 per tonne. | |
(10) | Cut-off grade utilized in 2025 reserves not less than 0.49 gram per tonne. | |
(11) | Cut-off grade utilized in 2025 reserves not less than 1.80 gram per tonne. | |
(12) | Cut-off grade utilized in 2025 reserves not less than 0.48 gram per tonne. | |
(13) | Cut-off grade utilized in 2025 reserves not less than 0.60 gram per tonne. | |
(14) | The Pueblo Viejo mine, which is 40% owned by Newmont, is accounted for as an equity method investment. Gold reserves at December 31, 2025 were estimated at a gold price of $1,500 per ounce. Gold reserves at December 31, 2025 and 2024 were provided by Barrick, the operator of Pueblo Viejo. | |
(15) | Project is currently undeveloped. Gold reserves at December 31, 2025 were estimated at a gold price of $1,300 per ounce. Gold reserves at December 31, 2025 and 2024 were provided by the NuevaUnión joint venture. | |
(16) | Project is currently undeveloped. Gold reserves at December 31, 2025 were estimated at a gold price of $1,700 per ounce. Gold reserves at December 31, 2025 and 2024 were provided by the Norte Abierto joint venture. | |
(17) | Gold reserves related to the underground mine at December 31, 2025 were estimated at a gold price of $1,300 per ounce. | |
(18) | Cut-off grade utilized in 2025 reserves not less than 0.15 gram per tonne. | |
(19) | Cut-off grade utilized in 2025 reserves not less than 0.44 gram per tonne. | |
(20) | Cut-off grade utilized in 2025 reserves not less than 3.34 gram per tonne. | |
(21) | Gold reserves at December 31, 2025 were estimated at a gold price of $1,500 per ounce. Gold reserves at December 31, 2025 and 2024 were provided by Barrick, the operator of the NGM joint venture. | |
(22) | Sites were classified as held for sale as of December 31, 2024 and were divested as of December 31, 2025. Refer to Note 3 of the Consolidated Financial Statements for further information on the Company's divestitures. | |
(23) | Leach pad material is the material on leach pads at the end of the year from which gold remains to be recovered. In-process reserves are reported separately where ounces exceed 100,000 and are greater than 5% of the total site-reported reserves. | |
Gold Resources at December 31, 2025 (1)(2) | ||||||||||||||||||||||||||||||
|
| Measured Resource | Indicated Resource | Measured and Indicated Resource | Inferred Resource |
| ||||||||||||||||||||||||
Deposits/Districts | Newmont Share | Tonnage (000 tonnes) | Grade (g/tonne) | Ounces(3) (000) | Tonnage (000 tonnes) | Grade (g/tonne) | Ounces(3) (000) | Tonnage (000 tonnes) | Grade (g/tonne) | Ounces(3) (000) | Tonnage (000 tonnes) | Grade (g/tonne) | Ounces(3) (000) | Metallurgical Recovery (3) | ||||||||||||||||
Lihir, Papua New Guinea | 100 | % | — | — | — | 37,500 | 1.99 | 2,400 | 37,500 | 1.99 | 2,400 | 239,800 | 2.4 | 18,300 | 75 | % | ||||||||||||||
Wafi-Golpu Open Pit (4) | 50 | % | — | — | — | 53,600 | 1.66 | 2,900 | 53,600 | 1.66 | 2,900 | 15,500 | 1.3 | 600 | 65 | % | ||||||||||||||
Wafi-Golpu Underground (5) | 50 | % | — | — | — | 140,800 | 0.45 | 2,000 | 140,800 | 0.45 | 2,000 | 91,900 | 0.6 | 1,900 | 68 | % | ||||||||||||||
Total Wafi-Golpu, Papua New Guinea (6) | 50 | % | — | — | — | 194,500 | 0.78 | 4,900 | 194,500 | 0.78 | 4,900 | 107,300 | 0.7 | 2,600 | 67 | % | ||||||||||||||
Cadia Underground | 100 | % | — | — | — | 1,009,300 | 0.29 | 9,400 | 1,009,300 | 0.29 | 9,400 | 163,900 | 0.2 | 1,300 | 81 | % | ||||||||||||||
Cadia Stockpiles | 100 | % | 28,500 | 0.30 | 300 | — | — | — | 28,500 | 0.30 | 300 | — | — | — | 64 | % | ||||||||||||||
Total Cadia, Australia | 100 | % | 28,500 | 0.30 | 300 | 1,009,300 | 0.29 | 9,400 | 1,037,800 | 0.29 | 9,700 | 163,900 | 0.2 | 1,300 | 81 | % | ||||||||||||||
Tanami Open Pit | 100 | % | 10,000 | 1.62 | 500 | 27,300 | 1.42 | 1,200 | 37,200 | 1.47 | 1,800 | 5,500 | 1.1 | 200 | 90 | % | ||||||||||||||
Tanami Underground | 100 | % | 2,600 | 3.35 | 300 | 6,800 | 3.77 | 800 | 9,400 | 3.65 | 1,100 | 17,600 | 4.4 | 2,500 | 96 | % | ||||||||||||||
Total Tanami, Australia | 100 | % | 12,500 | 1.98 | 800 | 34,100 | 1.89 | 2,100 | 46,600 | 1.91 | 2,900 | 23,100 | 3.6 | 2,700 | 94 | % | ||||||||||||||
Boddington, Australia | 100 | % | 97,300 | 0.52 | 1,600 | 168,200 | 0.49 | 2,600 | 265,500 | 0.50 | 4,300 | 3,800 | 0.5 | 100 | 85 | % | ||||||||||||||
Ahafo South Open Pit | 100 | % | 1,000 | 1.13 | — | 5,000 | 0.72 | 100 | 6,100 | 0.79 | 200 | 3,200 | 1.1 | 100 | 87 | % | ||||||||||||||
Ahafo South Underground | 100 | % | 1,200 | — | 100 | 41,400 | 3.84 | 5,100 | 42,500 | 3.84 | 5,200 | 19,500 | 2.9 | 1,800 | 91 | % | ||||||||||||||
Total Ahafo South, Ghana | 100 | % | 2,200 | 2.49 | 200 | 46,400 | 3.51 | 5,200 | 48,600 | 3.46 | 5,400 | 22,700 | 2.7 | 2,000 | 91 | % | ||||||||||||||
Ahafo North, Ghana | 100 | % | 6,600 | 1.44 | 300 | 36,300 | 1.74 | 2,000 | 42,900 | 1.69 | 2,300 | 18,100 | 1.6 | 900 | 90 | % | ||||||||||||||
Total Ahafo Complex, Ghana | 100 | % | 8,700 | 1.70 | 500 | 82,700 | 2.73 | 7,300 | 91,400 | 2.63 | 7,700 | 40,900 | 2.2 | 2,900 | 91 | % | ||||||||||||||
Merian, Suriname | 75 | % | 5,200 | 0.96 | 200 | 49,600 | 1.05 | 1,700 | 54,800 | 1.05 | 1,800 | 79,700 | 0.8 | 2,100 | 90 | % | ||||||||||||||
Cerro Negro, Argentina | 100 | % | 1,300 | 3.73 | 200 | 1,900 | 5.42 | 300 | 3,200 | 4.73 | 500 | 7,500 | 5.1 | 1,200 | 95 | % | ||||||||||||||
Pueblo Viejo, Dominican Republic (6)(7) | 40 | % | 7,300 | 1.31 | 300 | 33,100 | 1.37 | 1,500 | 40,300 | 1.36 | 1,800 | 6,300 | 1.5 | 300 | 81 | % | ||||||||||||||
NuevaUnión, Chile (6)(8) | 50 | % | 4,800 | 0.47 | 100 | 118,300 | 0.59 | 2,300 | 123,100 | 0.59 | 2,300 | 239,800 | 0.4 | 3,100 | 68 | % | ||||||||||||||
Norte Abierto, Chile (6)(9) | 50 | % | 77,700 | 0.61 | 1,500 | 525,500 | 0.51 | 8,600 | 603,200 | 0.52 | 10,100 | 381,100 | 0.4 | 5,300 | 78 | % | ||||||||||||||
Conga, Peru (6)(10) | 100 | % | — | — | — | 693,800 | 0.65 | 14,600 | 693,800 | 0.65 | 14,600 | 230,500 | 0.4 | 2,900 | 75 | % | ||||||||||||||
Yanacocha Open Pit | 100 | % | 12,800 | 0.41 | 200 | 99,100 | 0.70 | 2,300 | 111,900 | 0.67 | 2,400 | 360,300 | 0.5 | 6,200 | 58 | % | ||||||||||||||
Yanacocha Underground | 100 | % | 3,800 | 7.28 | 900 | 15,200 | 5.13 | 2,500 | 19,000 | 5.56 | 3,400 | 3,600 | 4.9 | 600 | 97 | % | ||||||||||||||
Total Yanacocha, Peru (11) | 100 | % | 16,600 | 1.98 | 1,100 | 114,300 | 1.29 | 4,700 | 130,900 | 1.38 | 5,800 | 363,900 | 0.6 | 6,700 | 71 | % | ||||||||||||||
Peñasquito, Mexico | 100 | % | 52,800 | 0.30 | 500 | 172,100 | 0.21 | 1,100 | 224,900 | 0.23 | 1,600 | 9,200 | 0.2 | 100 | 56 | % | ||||||||||||||
La Bikina, Mexico (6) | 50 | % | — | — | — | 19,900 | 0.37 | 200 | 19,900 | 0.37 | 200 | 1,600 | 0.2 | — | 50 | % | ||||||||||||||
Galore Creek, Canada (6)(12) | 50 | % | 212,800 | 0.29 | 2,000 | 385,600 | 0.22 | 2,700 | 598,400 | 0.25 | 4,700 | 118,900 | 0.2 | 700 | 75 | % | ||||||||||||||
Red Chris, Canada (13) | 70 | % | — | — | — | 334,800 | 0.34 | 3,700 | 334,800 | 0.34 | 3,700 | 62,000 | 0.3 | 700 | 55 | % | ||||||||||||||
Brucejack, Canada | 100 | % | — | — | — | 4,300 | 4.13 | 600 | 4,300 | 4.13 | 600 | 14,500 | 5.3 | 2,500 | 96 | % | ||||||||||||||
NGM Open Pit | 38.5 | % | 2,900 | 1.04 | 100 | 178,000 | 0.64 | 3,600 | 180,900 | 0.64 | 3,700 | 63,200 | 0.8 | 1,500 | 75 | % | ||||||||||||||
NGM Underground | 38.5 | % | 1,400 | 8.83 | 400 | 21,900 | 6.34 | 4,500 | 23,400 | 6.50 | 4,900 | 25,600 | 6.9 | 5,700 | 82 | % | ||||||||||||||
Total NGM, Nevada (14) | 38.5 | % | 4,300 | 3.61 | 500 | 199,900 | 1.26 | 8,100 | 204,300 | 1.31 | 8,600 | 88,900 | 2.5 | 7,300 | 80 | % | ||||||||||||||
Total Gold |
| 529,900 | 0.56 | 9,500 | 4,179,300 | 0.59 | 78,700 | 4,709,300 | 0.58 | 88,100 | 2,182,600 | 0.9 | 60,600 | 78 | % | |||||||||||||||
Gold Resources (1)(2) - December 31, 2024 | ||||||||||||||||||||||||||||||
|
| Measured Resource | Indicated Resource | Measured and Indicated Resource | Inferred Resource |
| ||||||||||||||||||||||||
Deposits/Districts | Newmont Share | Tonnage (000 tonnes) | Grade (g/tonne) | Ounces(3) (000) | Tonnage (000 tonnes) | Grade (g/tonne) | Ounces(3) (000) | Tonnage (000 tonnes) | Grade (g/tonne) | Ounces(3) (000) | Tonnage (000 tonnes) | Grade (g/tonne) | Ounces(3) (000) | Metallurgical Recovery (3) | ||||||||||||||||
Namosi, Fiji | 73.24 | % | — | — | — | 105,500 | 0.22 | 700 | 105,500 | 0.22 | 700 | 1,346,900 | 0.1 | 4,300 | 72 | % | ||||||||||||||
Lihir, Papua New Guinea | 100 | % | — | — | — | 44,600 | 1.97 | 2,800 | 44,600 | 1.97 | 2,800 | 227,400 | 2.4 | 17,600 | 75 | % | ||||||||||||||
Wafi-Golpu Open Pit | 50 | % | — | — | — | 53,600 | 1.66 | 2,900 | 53,600 | 1.66 | 2,900 | 15,500 | 1.3 | 600 | 65 | % | ||||||||||||||
Wafi-Golpu Underground | 50 | % | — | — | — | 140,800 | 0.45 | 2,000 | 140,800 | 0.45 | 2,000 | 91,900 | 0.6 | 1,900 | 68 | % | ||||||||||||||
Total Wafi-Golpu, Papua New Guinea (6) | 50 | % | — | — | — | 194,500 | 0.78 | 4,900 | 194,500 | 0.78 | 4,900 | 107,300 | 0.7 | 2,600 | 67 | % | ||||||||||||||
Cadia Underground | 100 | % | — | — | — | 1,245,100 | 0.36 | 14,200 | 1,245,100 | 0.36 | 14,200 | 549,400 | 0.3 | 4,800 | 81 | % | ||||||||||||||
Cadia Open Pit | 100 | % | 30,800 | 0.30 | 300 | — | — | — | 30,800 | 0.30 | 300 | 11,000 | 0.7 | 200 | 65 | % | ||||||||||||||
Total Cadia, Australia | 100 | % | 30,800 | 0.30 | 300 | 1,245,100 | 0.36 | 14,200 | 1,275,900 | 0.35 | 14,500 | 560,400 | 0.3 | 5,000 | 81 | % | ||||||||||||||
Tanami Open Pit | 100 | % | 9,700 | 1.65 | 500 | 26,500 | 1.45 | 1,200 | 36,200 | 1.50 | 1,700 | 5,300 | 1.1 | 200 | 90 | % | ||||||||||||||
Tanami Underground | 100 | % | 2,800 | 3.22 | 300 | 6,600 | 3.80 | 800 | 9,300 | 3.63 | 1,100 | 17,200 | 4.4 | 2,400 | 97 | % | ||||||||||||||
Total Tanami, Australia | 100 | % | 12,500 | 1.99 | 800 | 33,000 | 1.92 | 2,000 | 45,500 | 1.94 | 2,800 | 22,500 | 3.6 | 2,600 | 94 | % | ||||||||||||||
Boddington, Australia | 100 | % | 90,600 | 0.55 | 1,600 | 154,100 | 0.53 | 2,600 | 244,700 | 0.54 | 4,200 | 3,500 | 0.6 | 100 | 84 | % | ||||||||||||||
Ahafo South Open Pit | 100 | % | 3,900 | 1.13 | 100 | 6,500 | 0.83 | 200 | 10,400 | 0.95 | 300 | 3,500 | 1.2 | 100 | 85 | % | ||||||||||||||
Ahafo South Underground | 100 | % | 700 | 3.85 | 100 | 27,100 | 3.96 | 3,400 | 27,800 | 3.95 | 3,500 | 11,500 | 3.1 | 1,200 | 91 | % | ||||||||||||||
Total Ahafo South, Ghana | 100 | % | 4,700 | 1.56 | 200 | 33,500 | 3.35 | 3,600 | 38,200 | 3.13 | 3,800 | 15,000 | 2.7 | 1,300 | 91 | % | ||||||||||||||
Ahafo North, Ghana | 100 | % | 6,900 | 1.41 | 300 | 28,300 | 1.78 | 1,600 | 35,200 | 1.71 | 1,900 | 13,700 | 1.6 | 700 | 90 | % | ||||||||||||||
Total Ahafo Complex, Ghana | 100 | % | 11,600 | 1.47 | 500 | 61,800 | 2.64 | 5,200 | 73,400 | 2.45 | 5,700 | 28,700 | 2.2 | 2,000 | 91 | % | ||||||||||||||
Merian, Suriname | 75 | % | 5,800 | 1.03 | 200 | 58,600 | 1.08 | 2,000 | 64,500 | 1.08 | 2,200 | 70,000 | 0.9 | 2,000 | 90 | % | ||||||||||||||
Cerro Negro, Argentina | 100 | % | 1,300 | 3.77 | 200 | 1,900 | 5.65 | 300 | 3,200 | 4.88 | 500 | 7,600 | 4.8 | 1,200 | 94 | % | ||||||||||||||
Pueblo Viejo, Dominican Republic (6)(7) | 40 | % | 8,200 | 1.39 | 400 | 38,200 | 1.44 | 1,800 | 46,400 | 1.43 | 2,100 | 5,000 | 1.6 | 300 | 88 | % | ||||||||||||||
NuevaUnión, Chile (6)(8) | 50 | % | 4,800 | 0.47 | 100 | 118,300 | 0.59 | 2,300 | 123,100 | 0.59 | 2,300 | 239,800 | 0.4 | 3,100 | 68 | % | ||||||||||||||
Norte Abierto, Chile (6)(9) | 50 | % | 77,200 | 0.61 | 1,500 | 596,900 | 0.49 | 9,300 | 674,200 | 0.50 | 10,800 | 369,600 | 0.4 | 4,400 | 76 | % | ||||||||||||||
Conga, Peru (6) | 100 | % | — | — | — | 693,800 | 0.65 | 14,600 | 693,800 | 0.65 | 14,600 | 230,500 | 0.4 | 2,900 | 75 | % | ||||||||||||||
Yanacocha Open Pit | 100 | % | 16,600 | 0.41 | 200 | 109,200 | 0.40 | 1,400 | 125,700 | 0.40 | 1,600 | 287,200 | 0.6 | 5,100 | 66 | % | ||||||||||||||
Yanacocha Underground | 100 | % | 500 | 4.07 | 100 | 6,200 | 4.70 | 900 | 6,700 | 4.65 | 1,000 | 3,400 | 5.0 | 500 | 97 | % | ||||||||||||||
Total Yanacocha, Peru | 100 | % | 17,100 | 0.52 | 300 | 115,400 | 0.63 | 2,300 | 132,500 | 0.62 | 2,600 | 290,700 | 0.6 | 5,600 | 72 | % | ||||||||||||||
Peñasquito, Mexico | 100 | % | 48,200 | 0.30 | 500 | 163,100 | 0.22 | 1,100 | 211,300 | 0.24 | 1,600 | 21,100 | 0.2 | 100 | 57 | % | ||||||||||||||
La Bikina, Mexico (6) | 50 | % | — | — | — | 19,900 | 0.37 | 200 | 19,900 | 0.37 | 200 | 1,600 | 0.2 | — | 50 | % | ||||||||||||||
Galore Creek, Canada (6)(12) | 50 | % | 212,800 | 0.29 | 2,000 | 385,600 | 0.22 | 2,700 | 598,400 | 0.25 | 4,700 | 118,900 | 0.2 | 700 | 75 | % | ||||||||||||||
Red Chris, Canada | 70 | % | — | — | — | 335,100 | 0.34 | 3,700 | 335,100 | 0.34 | 3,700 | 62,100 | 0.3 | 700 | 55 | % | ||||||||||||||
Brucejack, Canada | 100 | % | — | — | — | 4,300 | 4.68 | 600 | 4,300 | 4.68 | 600 | 16,600 | 5.8 | 3,100 | 96 | % | ||||||||||||||
NGM Open Pit | 38.5 | % | 3,700 | 1.24 | 100 | 158,500 | 0.74 | 3,800 | 162,200 | 0.76 | 4,000 | 56,700 | 0.9 | 1,600 | 72 | % | ||||||||||||||
NGM Underground | 38.5 | % | 200 | 23.55 | 200 | 21,500 | 6.34 | 4,400 | 21,800 | 6.52 | 4,600 | 25,100 | 6.4 | 5,200 | 87 | % | ||||||||||||||
Total NGM, United States (14) | 38.5 | % | 3,900 | 2.51 | 300 | 180,000 | 1.41 | 8,200 | 183,900 | 1.44 | 8,500 | 81,800 | 2.6 | 6,700 | 82 | % | ||||||||||||||
Held for sale (15) |
|
|
|
|
|
|
|
|
|
|
|
|
|
| ||||||||||||||||
CC&V, United States | 100 | % | 20,300 | 0.53 | 300 | 26,500 | 0.48 | 400 | 46,700 | 0.50 | 800 | 71,400 | 0.4 | 900 | 51 | % | ||||||||||||||
Musselwhite, Canada | 100 | % | 1,500 | 4.21 | 200 | 2,300 | 4.10 | 300 | 3,800 | 4.15 | 500 | 1,900 | 5.0 | 300 | 96 | % | ||||||||||||||
Porcupine Underground | 100 | % | — | — | — | 1,000 | 7.70 | 300 | 1,100 | 7.59 | 300 | 1,900 | 7.8 | 500 | 92 | % | ||||||||||||||
Porcupine Open Pit | 100 | % | — | — | — | 75,600 | 1.51 | 3,700 | 75,600 | 1.51 | 3,700 | 65,900 | 1.4 | 2,900 | 92 | % | ||||||||||||||
Total Porcupine, Canada | 100 | % | — | — | — | 76,600 | 1.59 | 3,900 | 76,600 | 1.59 | 3,900 | 67,900 | 1.5 | 3,400 | 92 | % | ||||||||||||||
Éléonore, Canada | 100 | % | 400 | 4.94 | 100 | 2,900 | 4.11 | 400 | 3,300 | 4.21 | 400 | 2,400 | 4.6 | 400 | 92 | % | ||||||||||||||
Coffee, Canada (6) | 100 | % | 900 | 2.14 | 100 | 49,300 | 1.26 | 2,000 | 50,200 | 1.28 | 2,100 | 6,700 | 1.0 | 200 | 81 | % | ||||||||||||||
Akyem, Ghana | 100 | % | 800 | 0.73 | — | 9,700 | 3.83 | 1,200 | 10,600 | 3.58 | 1,200 | 5,500 | 3.0 | 500 | 92 | % | ||||||||||||||
Total Gold |
| 548,800 | 0.53 | 9,300 | 4,717,000 | 0.59 | 90,100 | 5,265,900 | 0.59 | 99,400 | 3,967,800 | 0.6 | 70,600 | 78 | % | |||||||||||||||
____________________________ | ||
(1) | Resources are reported exclusive of reserves. Amounts presented may not recalculate in total due to rounding. | |
(2) | At December 31, 2025 and 2024, gold resources at sites for which Newmont is the operator were estimated at a gold price of $2,300 and $2,000 per ounce, respectively, unless otherwise noted. Resources provided by other operators may use pricing that differs. Tonnage amounts have been rounded to the nearest 100,000. | |
(3) | Ounces are estimates of metal contained in ore tonnages and do not include allowances for processing losses. Metallurgical recovery rates represent the estimated amount of metal to be recovered through metallurgical extraction processes. Ounces may not recalculate as they are rounded to the nearest 100,000. | |
(4) | Project is currently undeveloped. Gold resources at December 31, 2025 were estimated at a gold price of $1,400 per ounce. | |
(5) | Project is currently undeveloped. Gold resources at December 31, 2025 were estimated at a gold price of $1,300 per ounce. | |
(6) | Included in the non-operating segment Corporate and Other in Note 4 to the Consolidated Financial Statements. | |
(7) | The Pueblo Viejo mine, which is 40% owned by Newmont, is accounted for as an equity method investment. Gold resources at December 31, 2025 were estimated at a gold price of $2,000 per ounce. Gold resources at December 31, 2025 and 2024 were provided by Barrick, the operator of Pueblo Viejo. | |
(8) | Project is currently undeveloped. Gold resources at December 31, 2025 were estimated at a gold price of $1,300 per ounce. Gold resources at December 31, 2025 and 2024 were provided by the NuevaUnión joint venture. | |
(9) | Project is currently undeveloped. Gold resources at December 31, 2025 were estimated at a gold price of $2,000 per ounce. Gold resources at December 31, 2025 and 2024 were provided by the Norte Abierto joint venture. | |
(10) | Gold resources at December 31, 2025 were estimated at a gold price of $1,400 per ounce. | |
(11) | Gold resources related to the Yanacocha Sulfides project at December 31, 2025 were estimated at a gold price of $1,400 per ounce. | |
(12) | Project is currently undeveloped. Resource estimates provided by Teck Resources, the Galore Creek joint venture partner. | |
(13) | Gold resources related to the underground mine at December 31, 2025 were estimated at a gold price of $1,400 per ounce. | |
(14) | Gold resources at December 31, 2025 were estimated at a gold price of $2,000 per ounce. Gold resources at December 31, 2025 and 2024 were provided by Barrick, the operator of the NGM joint venture. | |
(15) | Sites were classified as held for sale as of December 31, 2024 and were divested as of December 31, 2025. Refer to Note 3 of the Consolidated Financial Statements for further information on the Company's divestitures. | |
Copper Reserves (1) | ||||||||||||||||||||||||||||||||||
December 31, 2025 | December 31, 2024 | |||||||||||||||||||||||||||||||||
|
| Proven Reserves | Probable Reserves | Proven and Probable Reserves |
| Proven and Probable Reserves | ||||||||||||||||||||||||||||
Deposits/Districts | Newmont Share | Tonnage (2) (000 tonnes) | Grade (Cu %) | Tonnes (3) (000) | Tonnage (2) (000 tonnes) | Grade (Cu %) | Tonnes (3) (000) | Tonnage (2) (000 tonnes) | Grade (Cu %) | Tonnes (3) (000) | Metallurgical Recovery (3) | Tonnage (2) (000 tonnes) | Grade (Cu %) | Tonnes (3) (000) | ||||||||||||||||||||
Wafi-Golpu, Papua New Guinea (4)(5) | 50 | % | — | — | % | — | 194,500 | 1.20 | % | 2,300 | 194,500 | 1.20 | % | 2,300 | 95 | % | 194,500 | 1.20 | % | 2,300 | ||||||||||||||
Cadia, Australia (6) | 100 | % | — | — | % | — | 1,007,600 | 0.29 | % | 2,900 | 1,007,600 | 0.29 | % | 2,900 | 87 | % | 1,051,800 | 0.29 | % | 3,100 | ||||||||||||||
Boddington, Australia (7) | 100 | % | 271,000 | 0.09 | % | 200 | 274,100 | 0.10 | % | 300 | 545,100 | 0.09 | % | 500 | 81 | % | 559,800 | 0.09 | % | 500 | ||||||||||||||
NuevaUnión, Chile (5)(8) | 50 | % | — | — | % | — | 1,118,000 | 0.40 | % | 4,400 | 1,118,000 | 0.40 | % | 4,400 | 88 | % | 1,118,000 | 0.40 | % | 4,400 | ||||||||||||||
Norte Abierto, Chile (5)(9) | 50 | % | — | — | % | — | 521,100 | 0.24 | % | 1,200 | 521,100 | 0.24 | % | 1,200 | 79 | % | 598,800 | 0.22 | % | 1,300 | ||||||||||||||
Yanacocha, Peru | 100 | % | — | — | % | — | — | — | % | — | — | — | % | — | — | % | 111,100 | 0.63 | % | 700 | ||||||||||||||
Red Chris, Canada (10) | 70 | % | 2,600 | 0.41 | % | — | 178,900 | 0.52 | % | 900 | 181,500 | 0.52 | % | 900 | 84 | % | 186,400 | 0.52 | % | 1,000 | ||||||||||||||
NGM, United States (11) | 38.5 | % | 3,700 | 0.15 | % | — | 76,500 | 0.18 | % | 100 | 80,200 | 0.18 | % | 100 | 68 | % | 75,400 | 0.18 | % | 100 | ||||||||||||||
Total Copper |
| 277,300 | 0.09 | % | 200 | 3,370,700 | 0.36 | % | 12,300 | 3,648,000 | 0.34 | % | 12,500 | 87 | % | 3,895,800 | 0.35 | % | 13,500 | |||||||||||||||
____________________________ | ||
(1) | At December 31, 2025 and 2024, copper reserves at sites for which Newmont is the operator were estimated at a copper price of $3.75 and $3.50 per pound, respectively, unless otherwise noted. Reserves provided by other operators may use pricing that differs. Amounts presented may not recalculate in total due to rounding. | |
(2) | Tonnages include allowances for losses resulting from mining methods. Tonnages are rounded to nearest 100,000. | |
(3) | Tonnes are estimates of metal contained in ore tonnages and do not include allowances for processing losses. Metallurgical recovery rates represent the estimated amount of metal to be recovered through metallurgical extraction processes. Tonnes may not recalculate as they are rounded to the nearest 100,000. | |
(4) | Project is currently undeveloped. Copper reserves at December 31, 2025 were estimated at a copper price of $3.00 per pound. | |
(5) | Included in the non-operating segment Corporate and Other in Note 4 to the Consolidated Financial Statements. | |
(6) | The net smelter return value utilized in 2025 reserves not less than $24.62 per tonne. | |
(7) | The net smelter return value utilized in 2025 reserves not less than $18.24 per tonne. | |
(8) | Project is currently undeveloped. Copper reserves at December 31, 2025 were estimated at a copper price of $3.00 per pound. Copper reserves at December 31, 2025 and 2024 were provided by the NuevaUnión joint venture. | |
(9) | Project is currently undeveloped. Copper reserves at December 31, 2025 were estimated at a copper price of $3.50. Copper reserves at December 31, 2025 and 2024 were provided by the Norte Abierto joint venture. | |
(10) | Copper reserves related to the underground mine at December 31, 2025 were estimated at a copper price of $3.00 per pound. | |
(11) | Copper cut-off grade varies with gold and silver credits. Copper reserves at December 31, 2025 were estimated at a copper price of $3.25 per ounce. Copper reserves at December 31, 2025 and 2024 were provided by Barrick, the operator of the NGM joint venture. | |
Copper Resources (1)(2) - December 31, 2025 | ||||||||||||||||||||||||||||||||||
|
| Measured Resource | Indicated Resource | Measured and Indicated Resource | Inferred Resource |
| ||||||||||||||||||||||||||||
Deposits/Districts | Newmont Share | Tonnage (000 tonnes) | Grade (Cu%) | Tonnes (3) (000) | Tonnage (000 tonnes) | Grade (Cu%) | Tonnes (3) (000) | Tonnage (000 tonnes) | Grade (Cu%) | Tonnes (3) (000) | Tonnage (000 tonnes) | Grade (Cu%) | Tonnes (3) (000) | Metallurgical Recovery (3) | ||||||||||||||||||||
Wafi-Golpu, Papua New Guinea (4)(5) | 50 | % | — | — | % | — | 140,800 | 0.73 | % | 1,000 | 140,800 | 0.73 | % | 1,000 | 91,900 | 0.7 | % | 600 | 95 | % | ||||||||||||||
Cadia, Australia | 100 | % | 28,500 | 0.13 | % | — | 1,009,300 | 0.25 | % | 2,600 | 1,037,800 | 0.25 | % | 2,600 | 163,900 | 0.2 | % | 300 | 87 | % | ||||||||||||||
Boddington, Australia | 100 | % | 97,300 | 0.12 | % | 100 | 168,200 | 0.11 | % | 200 | 265,500 | 0.11 | % | 300 | 3,800 | 0.1 | % | — | 82 | % | ||||||||||||||
NuevaUnión, Chile (4)(6) | 50 | % | 164,300 | 0.19 | % | 300 | 349,900 | 0.34 | % | 1,200 | 514,100 | 0.30 | % | 1,500 | 602,200 | 0.4 | % | 2,300 | 89 | % | ||||||||||||||
Norte Abierto, Chile (4)(7) | 50 | % | 58,000 | 0.23 | % | 100 | 479,900 | 0.20 | % | 900 | 537,900 | 0.20 | % | 1,100 | 373,300 | 0.2 | % | 800 | 86 | % | ||||||||||||||
Conga, Peru (4)(8) | 100 | % | — | — | % | — | 693,800 | 0.26 | % | 1,800 | 693,800 | 0.26 | % | 1,800 | 230,500 | 0.2 | % | 400 | 84 | % | ||||||||||||||
Yanacocha, Peru (9) | 100 | % | 3,700 | 0.29 | % | — | 114,100 | 0.61 | % | 700 | 117,800 | 0.60 | % | 700 | 134,900 | 0.4 | % | 500 | 83 | % | ||||||||||||||
Galore Creek, Canada (4)(10) | 50 | % | 212,800 | 0.44 | % | 900 | 385,600 | 0.47 | % | 1,800 | 598,400 | 0.46 | % | 2,800 | 118,900 | 0.3 | % | 300 | 93 | % | ||||||||||||||
Red Chris, Canada (11) | 70 | % | — | — | % | — | 334,800 | 0.34 | % | 1,100 | 334,800 | 0.34 | % | 1,100 | 62,000 | 0.4 | % | 200 | 81 | % | ||||||||||||||
NGM, United States (12) | 38.5 | % | — | — | % | — | 130,600 | 0.16 | % | 200 | 130,600 | 0.16 | % | 200 | 12,100 | 0.1 | % | — | 69 | % | ||||||||||||||
Total Copper |
| 564,600 | 0.27 | % | 1,500 | 3,806,800 | 0.30 | % | 11,600 | 4,371,500 | 0.30 | % | 13,100 | 1,793,400 | 0.3 | % | 5,600 | 88 | % | |||||||||||||||
Copper Resources at December 31, 2024 (1)(2) | ||||||||||||||||||||||||||||||||||
|
| Measured Resources | Indicated Resources | Measured and Indicated Resources | Inferred Resources |
| ||||||||||||||||||||||||||||
Deposits/Districts | Newmont Share | Tonnage (000 tonnes) | Grade (Cu%) | Tonnes (3) (000) | Tonnage (000 tonnes) | Grade (Cu%) | Tonnes (3) (000) | Tonnage (000 tonnes) | Grade (Cu%) | Tonnoes (3) (000) | Tonnage (000 tonnes) | Grade (Cu%) | Tonnes (3) (000) | Metallurgical Recovery (3) | ||||||||||||||||||||
Namosi Open Pit | 73.24 | % | — | — | % | — | 105,500 | 0.61 | % | 600 | 105,500 | 0.61 | % | 600 | 1,346,900 | 0.3 | % | 4,300 | 84 | % | ||||||||||||||
Namosi Underground | 73.24 | % | — | — | % | — | — | — | % | — | — | — | % | — | 209,900 | 0.4 | % | 900 | 92 | % | ||||||||||||||
Total Namosi, Fiji (4) | 73.24 | % | — | — | % | — | 105,500 | 0.61 | % | 600 | 105,500 | 0.61 | % | 600 | 1,556,800 | 0.3 | % | 5,200 | 85 | % | ||||||||||||||
Wafi-Golpu, Papua New Guinea (4) | 50 | % | — | — | % | — | 140,800 | 0.73 | % | 1,000 | 140,800 | 0.73 | % | 1,000 | 91,900 | 0.7 | % | 600 | 95 | % | ||||||||||||||
Cadia, Australia | 100 | % | 30,800 | 0.13 | % | — | 1,245,100 | 0.25 | % | 3,200 | 1,275,900 | 0.25 | % | 3,200 | 560,400 | 0.2 | % | 1,000 | 86 | % | ||||||||||||||
Boddington, Australia | 100 | % | 90,600 | 0.12 | % | 100 | 154,100 | 0.11 | % | 200 | 244,700 | 0.12 | % | 300 | 3,500 | 0.1 | % | — | 83 | % | ||||||||||||||
NuevaUnión, Chile (4)(6) | 50 | % | 164,300 | 0.19 | % | 300 | 349,900 | 0.34 | % | 1,200 | 514,100 | 0.30 | % | 1,500 | 602,200 | 0.4 | % | 2,300 | 89 | % | ||||||||||||||
Norte Abierto, Chile (4)(7) | 50 | % | 57,600 | 0.24 | % | 100 | 551,300 | 0.19 | % | 1,100 | 608,900 | 0.20 | % | 1,200 | 361,800 | 0.2 | % | 700 | 90 | % | ||||||||||||||
Conga, Peru (4) | 100 | % | — | — | % | — | 693,800 | 0.26 | % | 1,800 | 693,800 | 0.26 | % | 1,800 | 230,500 | 0.2 | % | 400 | 84 | % | ||||||||||||||
Yanacocha, Peru | 100 | % | 1,500 | 1.02 | % | — | 99,800 | 0.36 | % | 400 | 101,300 | 0.37 | % | 400 | 39,700 | 0.4 | % | 100 | 81 | % | ||||||||||||||
Galore Creek, Canada (4)(10) | 50 | % | 212,800 | 0.44 | % | 900 | 385,600 | 0.47 | % | 1,800 | 598,400 | 0.46 | % | 2,800 | 118,900 | 0.3 | % | 300 | 93 | % | ||||||||||||||
Red Chris, Canada | 70 | % | — | — | % | — | 335,100 | 0.34 | % | 1,100 | 335,100 | 0.34 | % | 1,100 | 62,100 | 0.4 | % | 200 | 81 | % | ||||||||||||||
NGM, United States (12) | 38.5 | % | — | — | % | — | 113,700 | 0.17 | % | 200 | 113,700 | 0.17 | % | 200 | 11,100 | 0.2 | % | — | 67 | % | ||||||||||||||
Total Copper |
| 557,600 | 0.28 | % | 1,600 | 4,174,600 | 0.30 | % | 12,600 | 4,732,200 | 0.30 | % | 14,100 | 3,638,800 | 0.3 | % | 11,000 | 87 | % | |||||||||||||||
____________________________ | ||
(1) | Resources are reported exclusive of reserves. Amounts presented may not recalculate in total due to rounding. | |
(2) | At December 31, 2025 and 2024, copper resources at sites in which Newmont is the operator were estimated at a copper price of $4.25 and $4.00 per pound, respectively, unless otherwise noted. Resources provided by other operators may use pricing that differs. Tonnage amounts have been rounded to the nearest 100,000. | |
(3) | Tonnes are estimates of metal contained in ore tonnages and do not include allowances for processing losses. Metallurgical recovery rates represent the estimated amount of metal to be recovered through metallurgical extraction processes. Tonnes may not recalculate as they are rounded to the nearest 100,000. | |
(4) | Included in the non-operating segment Corporate and Other in Note 4 to the Consolidated Financial Statements. | |
(5) | Project is currently undeveloped. Copper resources related to the open pit mine at December 31, 2025 were estimated at a copper price of $3.40 per pound. | |
(6) | Project is currently undeveloped. Copper resources at December 31, 2025 were estimated at a copper price of $3.00 per pound. Copper resources at December 31, 2025 and 2024 were provided by the NuevaUnión joint venture. | |
(7) | Project is currently undeveloped. Copper resources at December 31, 2025 were estimated at a copper price of $4.00 per pound. Copper resources at December 31, 2025 and 2024 were provided by the Norte Abierto joint venture. | |
(8) | Copper resources at December 31, 2025 were estimated at a copper price of $3.50 per pound. | |
(9) | Copper resources related to the Yanacocha Sulfides project at December 31, 2025 were estimated at a copper price of $3.25 per pound. | |
(10) | Project is currently undeveloped. Resource estimates provided by Teck Resources. | |
(11) | Copper resources related to the underground mine at December 31, 2025 were estimated at a copper price of $3.40 per pound. | |
(12) | Copper resources at December 31, 2025 were estimated at a copper price of $4.50 per pound. Copper resources at December 31, 2025 and 2024 were provided by Barrick, the operator of the NGM joint venture. | |
Silver Reserves (1) | ||||||||||||||||||||||||||||||
December 31, 2025 | December 31, 2024 | |||||||||||||||||||||||||||||
|
| Proven Reserves | Probable Reserves | Proven and Probable Reserves |
| Proven and Probable Reserves | ||||||||||||||||||||||||
Deposits/Districts | Newmont Share | Tonnage (2) (000 tonnes) | Grade (g/tonne) | Ounces (3) (000) | Tonnage (2) (000 tonnes) | Grade (g/tonne) | Ounces (3) (000) | Tonnage (2) (000 tonnes) | Grade (g/tonne) | Ounces (3) (000) | Metallurgical Recovery (3) | Tonnage (2) (000 tonnes) | Grade (g/tonne) | Ounces (3) (000) | ||||||||||||||||
Cadia, Australia (4) | 100 | % | — | — | — | 1,007,600 | 0.67 | 21,800 | 1,007,600 | 0.67 | 21,800 | 67 | % | 1,051,800 | 0.67 | 22,800 | ||||||||||||||
Cerro Negro, Argentina | 100 | % | 2,200 | 84.41 | 5,900 | 6,800 | 66.20 | 14,400 | 9,000 | 70.62 | 20,300 | 74 | % | 9,300 | 71.58 | 21,400 | ||||||||||||||
Pueblo Viejo Open Pits | 40 | % | 35,800 | 12.01 | 13,800 | 51,300 | 11.58 | 19,100 | 87,100 | 11.76 | 32,900 | 53 | % | 81,700 | 11.86 | 31,200 | ||||||||||||||
Pueblo Viejo Stockpiles (5) | 40 | % | — | — | — | 36,900 | 13.59 | 16,100 | 36,900 | 13.59 | 16,100 | 53 | % | 38,800 | 14.22 | 17,700 | ||||||||||||||
Total Pueblo Viejo, Dominican Republic (6)(7) | 40 | % | 35,800 | 12.01 | 13,800 | 88,200 | 12.42 | 35,200 | 123,900 | 12.30 | 49,000 | 53 | % | 120,500 | 12.62 | 48,900 | ||||||||||||||
NuevaUnión, Chile (7)(8) | 50 | % | — | — | — | 1,118,000 | 1.31 | 47,200 | 1,118,000 | 1.31 | 47,200 | 66 | % | 1,118,000 | 1.31 | 47,200 | ||||||||||||||
Norte Abierto, Chile (7)(9) | 50 | % | — | — | — | 521,100 | 1.61 | 27,000 | 521,100 | 1.61 | 27,000 | 76 | % | 598,800 | 1.52 | 29,300 | ||||||||||||||
Yanacocha, Peru | 100 | % | — | — | — | 68,300 | 8.82 | 19,400 | 68,300 | 8.82 | 19,400 | 5 | % | 172,300 | 15.05 | 83,400 | ||||||||||||||
Peñasquito Open Pits | 100 | % | 79,500 | 34.50 | 88,200 | 114,800 | 31.09 | 114,700 | 194,300 | 32.49 | 202,900 | 83 | % | 224,700 | 31.09 | 224,600 | ||||||||||||||
Peñasquito Stockpiles (5) | 100 | % | 4,900 | 47.37 | 7,500 | 21,800 | 27.90 | 19,600 | 26,700 | 31.48 | 27,000 | 76 | % | 32,000 | 27.89 | 28,700 | ||||||||||||||
Total Peñasquito, Mexico | 100 | % | 84,400 | 35.25 | 95,700 | 136,600 | 30.58 | 134,300 | 221,000 | 32.37 | 230,000 | 82 | % | 256,600 | 30.70 | 253,300 | ||||||||||||||
Brucejack, Canada | 100 | % | — | — | — | 13,500 | 29.39 | 12,800 | 13,500 | 29.39 | 12,800 | 83 | % | 8,600 | 34.36 | 9,500 | ||||||||||||||
NGM Open Pit | 38.5 | % | — | — | — | 66,200 | 6.54 | 13,900 | 66,200 | 6.54 | 13,900 | 38 | % | 54,600 | 7.78 | 13,700 | ||||||||||||||
NGM Stockpiles (5) | 38.5 | % | 2,700 | 7.89 | 700 | — | — | — | 2,700 | 7.89 | 700 | 38 | % | 3,200 | 7.87 | 800 | ||||||||||||||
Total NGM, United States (10) | 38.5 | % | 2,700 | 7.89 | 700 | 66,200 | 6.54 | 13,900 | 68,900 | 6.59 | 14,600 | 38 | % | 57,900 | 7.78 | 14,500 | ||||||||||||||
Total Silver |
| 125,000 | 28.88 | 116,000 | 3,026,200 | 3.35 | 326,000 | 3,151,200 | 4.36 | 442,000 | 71 | % | 3,393,800 | 4.86 | 530,200 | |||||||||||||||
____________________________ | ||
(1) | At December 31, 2025 and 2024, silver reserves at sites for which Newmont is the operator were estimated at a silver price of $25 and $20 per ounce, respectively, unless otherwise noted. Reserves provided by other operators may use pricing that differs. Amounts presented may not recalculate in total due to rounding. | |
(2) | Tonnages include allowances for losses resulting from mining methods. Tonnages are rounded to nearest 100,000. | |
(3) | Ounces are estimates of metal contained in ore tonnages and do not include allowances for processing losses. Metallurgical recovery rates represent the estimated amount of metal to be recovered through metallurgical extraction processes. Ounces may not recalculate as they are rounded to the nearest 100,000. | |
(4) | The net smelter return value utilized in 2025 reserves not less than $24.62 per tonne. | |
(5) | Stockpiles are comprised primarily of material that has been set aside to allow processing of higher grade material in the mills. Stockpiles increase or decrease depending on current mine plans. Stockpile reserves are reported separately where ounces exceed 100,000 and are greater than 5% of the total site-reported reserves. | |
(6) | The Pueblo Viejo mine, which is 40% owned by Newmont, is accounted for as an equity method investment. Silver reserves at December 31, 2025 were estimated at a silver price of $21 per ounce. Silver reserves at December 31, 2025 and 2024 were provided by Barrick, the operator of Pueblo Viejo. | |
(7) | Included in the non-operating segment Corporate and Other in Note 4 to the Consolidated Financial Statements. | |
(8) | Project is currently undeveloped. Silver reserves at December 31, 2025 were estimated at a silver price of $18 per ounce. Silver reserves at December 31, 2025 and 2024 were provided by the NuevaUnión joint venture. | |
(9) | Project is currently undeveloped. Silver reserves at December 31, 2025 were estimated at a silver price of $25 per ounce. Silver reserves at December 31, 2025 and 2024 were provided by the Norte Abierto joint venture. | |
(10) | Silver cut-off grade varies with gold and copper credits. Silver reserves at December 31, 2025 were estimated at a silver price of $21 per ounce. Silver reserves at December 31, 2025 and 2024 were provided by Barrick, the operator of the NGM joint venture. | |
| ||
Silver Resources (1)(2) - December 31, 2025 | ||||||||||||||||||||||||||||||
|
| Measured Resource | Indicated Resource | Measured and Indicated Resource | Inferred Resource |
| ||||||||||||||||||||||||
Deposits/Districts | Newmont Share | Tonnage (000 tonnes) | Grade (g/tonne) | Ounces (3) (000) | Tonnage (000 tonnes) | Grade (g/tonne) | Ounces (3) (000) | Tonnage (000 tonnes) | Grade (g/tonne) | Ounces (3) (000) | Tonnage (000 tonnes) | Grade (g/tonne) | Ounces (3) (000) | Metallurgical Recovery (3) | ||||||||||||||||
Wafi-Golpu, Papua New Guinea (4) | 50 | % | — | — | — | 53,600 | 4.42 | 7,600 | 53,600 | 4.42 | 7,600 | 15,500 | 4.5 | 2,200 | 45 | % | ||||||||||||||
Cadia, Australia | 100 | % | — | — | — | 1,009,300 | 0.62 | 20,200 | 1,009,300 | 0.62 | 20,200 | 163,900 | 0.4 | 2,300 | 68 | % | ||||||||||||||
Pueblo Viejo, Dominican Republic (4)(5) | 40 | % | 7,300 | 6.95 | 1,600 | 33,100 | 7.79 | 8,300 | 40,300 | 7.64 | 9,900 | 6,300 | 8.3 | 1,700 | 53 | % | ||||||||||||||
NuevaUnión, Chile (4)(6) | 50 | % | 164,300 | 0.96 | 5,100 | 349,900 | 1.19 | 13,400 | 514,100 | 1.12 | 18,400 | 602,200 | 1.2 | 22,500 | 66 | % | ||||||||||||||
Norte Abierto, Chile (4)(7) | 50 | % | 77,700 | 1.21 | 3,000 | 525,500 | 1.07 | 18,100 | 603,200 | 1.09 | 21,100 | 381,100 | 1.0 | 12,600 | 79 | % | ||||||||||||||
Peñasquito, Mexico | 100 | % | 52,800 | 28.32 | 48,100 | 172,100 | 25.28 | 139,900 | 224,900 | 26.00 | 188,000 | 9,200 | 24.2 | 7,100 | 80 | % | ||||||||||||||
La Bikina, Mexico (4) | 50 | % | — | — | — | 19,900 | 13.99 | 9,000 | 19,900 | 13.99 | 9,000 | 1,600 | 11.0 | 500 | 25 | % | ||||||||||||||
Cerro Negro Underground | 100 | % | 100 | 72.50 | 200 | 700 | 57.19 | 1,300 | 800 | 59.07 | 1,500 | 7,200 | 28.3 | 6,500 | 75 | % | ||||||||||||||
Cerro Negro Open Pit | 100 | % | 1,200 | 6.76 | 300 | 1,200 | 6.62 | 300 | 2,400 | 6.70 | 500 | 300 | 6.7 | 100 | 71 | % | ||||||||||||||
Total Cerro Negro, Argentina | 100 | % | 1,300 | 11.74 | 500 | 1,900 | 25.50 | 1,600 | 3,200 | 19.88 | 2,000 | 7,500 | 27.4 | 6,600 | 75 | % | ||||||||||||||
Conga, Peru (4)(8) | 100 | % | — | — | — | 693,800 | 2.06 | 45,900 | 693,800 | 2.06 | 45,900 | 175,000 | 1.1 | 6,300 | 70 | % | ||||||||||||||
Yanacocha Open Pit | 100 | % | 15,600 | 7.91 | 3,900 | 96,300 | 19.80 | 61,300 | 111,900 | 18.14 | 65,200 | 89,500 | 14.3 | 41,300 | 55 | % | ||||||||||||||
Yanacocha Leach Pad (9) | 100 | % | — | — | — | 57,100 | 2.03 | 3,700 | 57,100 | 2.03 | 3,700 | 11,600 | 4.4 | 1,600 | 3 | % | ||||||||||||||
Yanacocha Underground | 100 | % | 3,700 | 0.21 | — | 14,900 | 15.49 | 7,400 | 18,600 | 12.45 | 7,400 | 3,600 | 38.4 | 4,400 | 83 | % | ||||||||||||||
Total Yanacocha, Peru (10) | 100 | % | 19,300 | 6.41 | 4,000 | 168,200 | 13.39 | 72,400 | 187,500 | 12.67 | 76,400 | 104,700 | 14.1 | 47,300 | 55 | % | ||||||||||||||
Galore Creek, Canada (4)(11) | 50 | % | 212,800 | 4.08 | 27,900 | 385,600 | 4.77 | 59,100 | 598,400 | 4.52 | 87,000 | 118,900 | 2.6 | 9,900 | 73 | % | ||||||||||||||
Brucejack, Canada | 100 | % | — | — | — | 4,300 | 15.90 | 2,200 | 4,300 | 15.90 | 2,200 | 14,500 | 11.7 | 5,500 | 82 | % | ||||||||||||||
NGM, United States (12) | 38.5 | % | — | — | — | 121,000 | 5.22 | 20,300 | 121,000 | 5.22 | 20,300 | 10,100 | 5.4 | 1,800 | 38 | % | ||||||||||||||
Total Silver |
| 535,500 | 5.24 | 90,200 | 3,538,100 | 3.67 | 418,000 | 4,073,600 | 3.88 | 508,200 | 1,610,400 | 2.4 | 126,400 | 68 | % | |||||||||||||||
Silver Resources (1)(2) - December 31, 2024 | ||||||||||||||||||||||||||||||
|
| Measured Resource | Indicated Resource | Measured and Indicated Resource | Inferred Resource |
| ||||||||||||||||||||||||
Deposits/Districts | Newmont Share | Tonnage (000 tonnes) | Grade (g/tonne) | Ounces (3) (000) | Tonnage (000 tonnes) | Grade (g/tonne) | Ounces (3) (000) | Tonnage (000 tonnes) | Grade (g/tonne) | Ounces (3) (000) | Tonnage (000 tonnes) | Grade (g/tonne) | Ounces (3) (000) | Metallurgical Recovery (3) | ||||||||||||||||
Wafi-Golpu, Papua New Guinea (4) | 50 | % | — | — | — | 53,600 | 4.42 | 7,600 | 53,600 | 4.42 | 7,600 | 15,500 | 4.5 | 2,200 | 45 | % | ||||||||||||||
Cadia, Australia | 100 | % | — | — | — | 1,245,100 | 0.65 | 26,100 | 1,245,100 | 0.65 | 26,100 | 549,400 | 0.4 | 7,900 | 67 | % | ||||||||||||||
Pueblo Viejo, Dominican Republic (4)(5) | 40 | % | 8,200 | 7.69 | 2,000 | 38,200 | 7.82 | 9,600 | 46,400 | 7.80 | 11,600 | 5,000 | 6.8 | 1,100 | 71 | % | ||||||||||||||
NuevaUnión, Chile (4)(6) | 50 | % | 164,300 | 0.96 | 5,100 | 349,900 | 1.19 | 13,400 | 514,100 | 1.12 | 18,400 | 602,200 | 1.2 | 22,500 | 66 | % | ||||||||||||||
Norte Abierto, Chile (4)(7) | 50 | % | 77,200 | 1.20 | 3,000 | 596,900 | 1.07 | 20,600 | 674,200 | 1.09 | 23,500 | 369,600 | 1.0 | 11,300 | 78 | % | ||||||||||||||
Peñasquito, Mexico | 100 | % | 48,200 | 27.22 | 42,200 | 163,100 | 24.84 | 130,300 | 211,300 | 25.39 | 172,400 | 21,100 | 25.4 | 17,200 | 80 | % | ||||||||||||||
La Bikina, Mexico (4) | 50 | % | — | — | — | 19,900 | 13.99 | 9,000 | 19,900 | 13.99 | 9,000 | 1,600 | 11.0 | 500 | 25 | % | ||||||||||||||
Cerro Negro Underground | 100 | % | 100 | 70.12 | 300 | 700 | 61.42 | 1,400 | 900 | 62.67 | 1,700 | 7,300 | 26.5 | 6,200 | 76 | % | ||||||||||||||
Cerro Negro Open Pit | 100 | % | 1,200 | 6.76 | 300 | 1,200 | 6.62 | 300 | 2,400 | 6.70 | 500 | 300 | 6.7 | 100 | 71 | % | ||||||||||||||
Total Cerro Negro, Argentina | 100 | % | 1,300 | 12.61 | 500 | 1,900 | 27.54 | 1,700 | 3,200 | 21.43 | 2,200 | 7,600 | 25.7 | 6,300 | 75 | % | ||||||||||||||
Conga, Peru (4) | 100 | % | — | — | — | 693,800 | 2.06 | 45,900 | 693,800 | 2.06 | 45,900 | 175,000 | 1.1 | 6,300 | 70 | % | ||||||||||||||
Yanacocha Open Pit | 100 | % | 16,300 | 6.71 | 3,500 | 103,900 | 10.16 | 33,900 | 120,200 | 9.69 | 37,400 | 26,300 | 13.4 | 11,400 | 43 | % | ||||||||||||||
Yanacocha Leach Pad | 100 | % | — | — | — | — | — | — | — | — | — | 62,700 | 2.2 | 4,500 | 4 | % | ||||||||||||||
Yanacocha Underground | 100 | % | 500 | 0.37 | — | 6,200 | 37.02 | 7,300 | 6,700 | 34.23 | 7,400 | 3,400 | 40.4 | 4,400 | 83 | % | ||||||||||||||
Total Yanacocha, Peru | 100 | % | 16,800 | 6.52 | 3,500 | 110,100 | 11.66 | 41,300 | 126,900 | 10.98 | 44,800 | 92,400 | 6.8 | 20,300 | 47 | % | ||||||||||||||
Galore Creek, Canada (4)(11) | 50 | % | 212,800 | 4.08 | 27,900 | 385,600 | 4.77 | 59,100 | 598,400 | 4.52 | 87,000 | 118,900 | 2.6 | 9,900 | 73 | % | ||||||||||||||
Brucejack, Canada | 100 | % | — | — | — | 4,300 | 19.68 | 2,700 | 4,300 | 19.68 | 2,700 | 16,600 | 11.6 | 6,200 | 82 | % | ||||||||||||||
NGM, United States (12) | 38.5 | % | — | — | — | 98,300 | 5.64 | 17,800 | 98,300 | 5.64 | 17,800 | 10,300 | 4.2 | 1,400 | 38 | % | ||||||||||||||
Total Silver |
| 528,900 | 4.96 | 84,300 | 3,760,700 | 3.18 | 385,000 | 4,289,600 | 3.40 | 469,200 | 1,985,100 | 1.8 | 113,200 | 69 | % | |||||||||||||||
___________________________ | ||
(1) | Resources are reported exclusive of reserves. Amounts presented may not recalculate in total due to rounding. | |
(2) | At December 31, 2025 and 2024, silver resources at sites in which Newmont is the operator were estimated at a silver price of $28 and $23 per ounce, respectively, unless otherwise noted. Resources provided by other operators may use pricing that differs. Tonnage amounts have been rounded to the nearest 100,000. | |
(3) | Ounces are estimates of metal contained in ore tonnages and do not include allowances for processing losses. Metallurgical recovery rates represent the estimated amount of metal to be recovered through metallurgical extraction processes. Ounces may not recalculate as they are rounded to the nearest 100,000. | |
(4) | Included in the non-operating segment Corporate and Other in Note 4 to the Consolidated Financial Statements. | |
(5) | Silver resources at December 31, 2025 were estimated at a silver price of $25 per ounce. Silver resources at December 31, 2025 and 2024 were provided by Barrick, the operator of the Pueblo Viejo. | |
(6) | Project is currently undeveloped. Silver resources at December 31, 2025 were estimated at a silver price of $18 per ounce. Silver resources at December 31, 2025 and 2024 were provided by the NuevaUnión joint venture. | |
(7) | Project is currently undeveloped. Silver resources at December 31, 2025 were estimated at a silver price of $23 per ounce. Silver resources at December 31, 2025 and 2024 were provided by the Norte Abierto joint venture. | |
(8) | Silver resources at December 31, 2025 were estimated at a silver price of $26 per ounce. | |
(9) | Leach pad material is the material on leach pads at the end of the year from which silver remains to be recovered. In-process resources are reported separately where ounces exceed 100,000 and are greater than 5% of the total site-reported resources. | |
(10) | Silver resources related to the Yanacocha Sulfides project at December 31, 2025 were estimated at a silver price of $23 per ounce. | |
(11) | Project is currently undeveloped. Resource estimates provided by Teck Resources. | |
(12) | Silver resources at December 31, 2025 were estimated at a silver price of $25 per ounce. Silver resources at December 31, 2025 and 2024 were provided by Barrick, the operator of the NGM joint venture. | |
Lead Reserves (1) | ||||||||||||||||||||||||||||||||||
December 31, 2025 | December 31, 2024 | |||||||||||||||||||||||||||||||||
|
| Proven Reserves | Probable Reserves | Proven and Probable Reserves |
| Proven and Probable Reserves | ||||||||||||||||||||||||||||
Deposits/Districts | Newmont Share | Tonnage (2) (000 tonnes) | Grade (Pb %) | Tonnes (3) (000) | Tonnage (2) (000 tonnes) | Grade (Pb %) | Tonnes (3) (000) | Tonnage (2) (000 tonnes) | Grade (Pb %) | Tonnes (3) (000) | Metallurgical Recovery (3) | Tonnage (2) (000 tonnes) | Grade (Pb %) | Tonnes (3) (000) | ||||||||||||||||||||
Peñasquito, Mexico | 100 | % | 84,400 | 0.34 | % | 300 | 136,600 | 0.28 | % | 400 | 221,000 | 0.30 | % | 700 | 75 | % | 256,600 | 0.31 | % | 800 | ||||||||||||||
Total Lead |
| 84,400 | 0.34 | % | 300 | 136,600 | 0.28 | % | 400 | 221,000 | 0.30 | % | 700 | 75 | % | 256,600 | 0.31 | % | 800 | |||||||||||||||
____________________________ | ||
(1) | At December 31, 2025 and 2024, lead reserves were estimated at a lead price of $0.90 per pound. Amounts presented may not recalculate in total due to rounding. | |
(2) | Tonnages include allowances for losses resulting from mining methods. Tonnages are rounded to nearest 100,000. | |
(3) | Tonnes are estimates of metal contained in ore tonnages and do not include allowances for processing losses. Metallurgical recovery rates represent the estimated amount of metal to be recovered through metallurgical extraction processes. Tonnes may not recalculate as they are rounded to the nearest 100,000. | |
Lead Resources (1)(2) - December 31, 2025 | ||||||||||||||||||||||||||||||||||
|
| Measured Resource | Indicated Resource | Measured and Indicated Resource | Inferred Resource |
| ||||||||||||||||||||||||||||
Deposits/Districts | Newmont Share | Tonnage (000 tonnes) | Grade (Pb %) | Tonnes (3) (000) | Tonnage (000 tonnes) | Grade (Pb %) | Tonnes (3) (000) | Tonnage (000 tonnes) | Grade (Pb %) | Tonnes (3) (000) | Tonnage (000 tonnes) | Grade (Pb %) | Tonnes (3) (000) | Metallurgical Recovery (3) | ||||||||||||||||||||
Peñasquito, Mexico | 100 | % | 52,800 | 0.26 | % | 100 | 172,100 | 0.24 | % | 400 | 224,900 | 0.24 | % | 500 | 9,200 | 0.2 | % | — | 73 | % | ||||||||||||||
Total Lead |
| 52,800 | 0.26 | % | 100 | 172,100 | 0.24 | % | 400 | 224,900 | 0.24 | % | 500 | 9,200 | 0.2 | % | — | 73 | % | |||||||||||||||
Lead Resources (1)(2) - December 31, 2024 | ||||||||||||||||||||||||||||||||||
|
| Measured Resource | Indicated Resource | Measured and Indicated Resource | Inferred Resource |
| ||||||||||||||||||||||||||||
Deposits/Districts | Newmont Share | Tonnage (000 tonnes) | Grade (Pb %) | Tonnes (3) (000) | Tonnage (000 tonnes) | Grade (Pb %) | Tonnes (3) (000) | Tonnage (000 tonnes) | Grade (Pb %) | Tonnes (3) (000) | Tonnage (000 tonnes) | Grade (Pb %) | Tonnes (3) (000) | Metallurgical Recovery (3) | ||||||||||||||||||||
Peñasquito, Mexico | 100 | % | 48,200 | 0.25 | % | 100 | 163,100 | 0.23 | % | 400 | 211,300 | 0.23 | % | 500 | 21,100 | 0.2 | % | — | 73 | % | ||||||||||||||
Total Lead |
| 48,200 | 0.25 | % | 100 | 163,100 | 0.23 | % | 400 | 211,300 | 0.23 | % | 500 | 21,100 | 0.2 | % | — | 73 | % | |||||||||||||||
____________________________ | ||
(1) | Resources are reported exclusive of reserves. | |
(2) | At December 31, 2025 and 2024, lead resources were estimated at a lead price of $1.00 per pound. Tonnage amounts have been rounded to the nearest 100,000. | |
(3) | Tonnes are estimates of metal contained in ore tonnages and do not include allowances for processing losses. Metallurgical recovery rates represent the estimated amount of metal to be recovered through metallurgical extraction processes. Tonnes may not recalculate as they are rounded to the nearest 100,000. | |
Zinc Reserves (1) | ||||||||||||||||||||||||||||
December 31, 2025 | December 31, 2024 | |||||||||||||||||||||||||||
|
| Proven Reserves | Probable Reserves | Proven and Probable Reserves |
| Proven and Probable Reserves | ||||||||||||||||||||||
Deposits/Districts | Newmont Share | Tonnage (2) (000 tonnes) | Grade (Zn %) | Tonnes (3) (000) | Tonnage (2) (000 tonnes) | Grade (Zn %) | Tonnes (3) (000) | Tonnage (2) (000 tonnes) | Grade (Zn %) | Tonnes (3) (000) | Metallurgical Recovery (3) | Tonnage (2) (000 tonnes) | Grade (Zn %) | Tonnes (3) (000) | ||||||||||||||
Peñasquito Open Pits, Mexico | 100% | 79,500 | 0.77% | 600 | 114,800 | 0.60% | 700 | 194,300 | 0.67% | 1,300 | 83% | 224,700 | 0.69% | 1,500 | ||||||||||||||
Peñasquito Stockpiles, Mexico (4) | 100% | 4,900 | 1.25% | 100 | 21,800 | 0.54% | 100 | 26,700 | 0.67% | 200 | 78% | 32,000 | 0.58% | 200 | ||||||||||||||
Total Zinc |
| 84,400 | 0.80% | 700 | 136,600 | 0.59% | 800 | 221,000 | 0.67% | 1,500 | 82% | 256,600 | 0.68% | 1,700 | ||||||||||||||
____________________________ | ||
(1) | At December 31, 2025 and 2024, zinc reserves were estimated at a zinc price of $1.20 per pound. Amounts presented may not recalculate in total due to rounding. | |
(2) | Tonnages include allowances for losses resulting from mining methods. Tonnages are rounded to nearest 100,000. | |
(3) | Tonnes are estimates of metal contained in ore tonnages and do not include allowances for processing losses. Metallurgical recovery rates represent the estimated amount of metal to be recovered through metallurgical extraction processes. Tonnes may not recalculate as they are rounded to the nearest 100,000. | |
(4) | Stockpiles are comprised primarily of material that has been set aside to allow processing of higher grade material in the mills. Stockpiles increase or decrease depending on current mine plans. Stockpile reserves are reported separately where pounds exceed 100 million and are greater than 5% of the total site-reported reserves. | |
Zinc Resources (1)(2) - December 31, 2025 | ||||||||||||||||||||||||||||||||||
|
| Measured Resource | Indicated Resource | Measured and Indicated Resource | Inferred Resource |
| ||||||||||||||||||||||||||||
Deposits/Districts | Newmont Share | Tonnage (000 tonnes) | Grade (Zn %) | Tonnes (3) (000) | Tonnage (000 tonnes) | Grade (Zn %) | Tonnes (3) (000) | Tonnage (000 tonnes) | Grade (Zn %) | Tonnes (3) (000) | Tonnage (000 tonnes) | Grade (Zn %) | Tonnes (3) (000) | Metallurgical Recovery (3) | ||||||||||||||||||||
Peñasquito, Mexico | 100 | % | 52,800 | 0.72 | % | 400 | 172,100 | 0.57 | % | 1,000 | 224,900 | 0.60 | % | 1,400 | 9,200 | 0.5 | % | — | 82 | % | ||||||||||||||
Total Zinc |
| 52,800 | 0.72 | % | 400 | 172,100 | 0.57 | % | 1,000 | 224,900 | 0.60 | % | 1,400 | 9,200 | 0.5 | % | — | 82 | % | |||||||||||||||
Zinc Resources (1)(2) - December 31, 2024 | ||||||||||||||||||||||||||||||||||
|
| Measured Resource | Indicated Resource | Measured and Indicated Resource | Inferred Resource |
| ||||||||||||||||||||||||||||
Deposits/Districts | Newmont Share | Tonnage (000 tonnes) | Grade (Zn %) | Tonnes (3) (000) | Tonnage (000 tonnes) | Grade (Zn %) | Tonnes (3) (000) | Tonnage (000 tonnes) | Grade (Zn %) | Tonnes (3) (000) | Tonnage (000 tonnes) | Grade (Zn %) | Tonnes (3) (000) | Metallurgical Recovery (3) | ||||||||||||||||||||
Peñasquito, Mexico | 100 | % | 48,200 | 0.69 | % | 300 | 163,100 | 0.55 | % | 900 | 211,300 | 0.59 | % | 1,200 | 21,100 | 0.6 | % | 100 | 81 | % | ||||||||||||||
Total Zinc |
| 48,200 | 0.69 | % | 300 | 163,100 | 0.55 | % | 900 | 211,300 | 0.59 | % | 1,200 | 21,100 | 0.6 | % | 100 | 81 | % | |||||||||||||||
____________________________ | ||
(1) | Resources are reported exclusive of reserves. | |
(2) | At December 31, 2025 and 2024, zinc resources were estimated at a zinc price of $1.30 per pound. Tonnage amounts have been rounded to the nearest 100,000. | |
(3) | Tonnes are estimates of metal contained in ore tonnages and do not include allowances for processing losses. Metallurgical recovery rates represent the estimated amount of metal to be recovered through metallurgical extraction processes. Tonnes may not recalculate as they are rounded to the nearest 100,000. | |
Molybdenum Reserves (1) | ||||||||||||||||||||||||||||||||||
December 31, 2025 | December 31, 2024 | |||||||||||||||||||||||||||||||||
|
| Proven Reserves | Probable Reserves | Proven and Probable Reserves |
| Proven and Probable Reserves | ||||||||||||||||||||||||||||
Deposits/Districts | Newmont Share | Tonnage (2) (000 tonnes) | Grade (Mo %) | Tonnes (3) (000) | Tonnage (2) (000 tonnes) | Grade (Mo %) | Tonnes (3) (000) | Tonnage (2) (000 tonnes) | Grade (Mo %) | Tonnes (3) (000) | Metallurgical Recovery (3) | Tonnage (2) (000 tonnes) | Grade (Mo %) | Tonnes (3) (000) | ||||||||||||||||||||
Cadia, Australia (4) | 100 | % | — | — | % | — | 996,400 | 0.01 | % | 100 | 996,400 | 0.01 | % | 100 | 67 | % | 1,040,600 | 0.01 | % | 100 | ||||||||||||||
NuevaUnión, Chile (5)(6) | 50 | % | — | — | % | — | 776,900 | 0.02 | % | 100 | 776,900 | 0.02 | % | 100 | 48 | % | 776,900 | 0.02 | % | 100 | ||||||||||||||
Total Molybdenum |
| — | — | % | — | 1,773,300 | 0.01 | % | 200 | 1,773,300 | 0.01 | % | 200 | 56 | % | 1,817,500 | 0.01 | % | 200 | |||||||||||||||
____________________________ | ||
(1) | At December 31, 2025 and 2024, molybdenum reserves at sites for which Newmont is the operator were estimated at a molybdenum price of $13 per pound, unless otherwise noted. Amounts presented may not recalculate in total due to rounding. | |
(2) | Tonnages include allowances for losses resulting from mining methods. Tonnages are rounded to nearest 100,000. | |
(3) | Tonnes are estimates of metal contained in ore tonnages and do not include allowances for processing losses. Metallurgical recovery rates represent the estimated amount of metal to be recovered through metallurgical extraction processes. Tonnes may not recalculate as they are rounded to the nearest 100,000. | |
(4) | The net smelter return value utilized in 2025 reserves not less than $25 per tonne. | |
(5) | Project is currently undeveloped. Molybdenum reserves at December 31, 2025 were estimated at a molybdenum price of $10 per pound. Molybdenum reserves at December 31, 2025 and 2024 were provided by the NuevaUnión joint venture. | |
(6) | Included in the non-operating segment Corporate and Other in Note 4 to the Consolidated Financial Statements. | |
Molybdenum Resources (1)(2) - December 31, 2025 | ||||||||||||||||||||||||||||||||||
|
| Measured Resource | Indicated Resource | Measured and Indicated Resource | Inferred Resource |
| ||||||||||||||||||||||||||||
Deposits/Districts | Newmont Share | Tonnage (000 tonnes) | Grade (Mo %) | Tonnes (3) (000) | Tonnage (000 tonnes) | Grade (Mo %) | Tonnes (3) (000) | Tonnage (000 tonnes) | Grade (Mo %) | Tonnes (3) (000) | Tonnage (000 tonnes) | Grade (Mo %) | Tonnes (3) (000) | Metallurgical Recovery (3) | ||||||||||||||||||||
Cadia, Australia | 100 | % | — | — | % | — | 938,100 | 0.01 | % | 100 | 938,100 | 0.01 | % | 100 | 124,200 | — | % | — | 67 | % | ||||||||||||||
NuevaUnión, Chile (4) | 50 | % | 159,500 | 0.01 | % | — | 231,500 | 0.01 | % | — | 391,000 | 0.01 | % | — | 362,300 | — | % | — | 52 | % | ||||||||||||||
Total Molybdenum |
| 159,500 | 0.01 | % | — | 1,169,600 | 0.01 | % | 100 | 1,329,100 | 0.01 | % | 100 | 486,500 | — | % | — | 59 | % | |||||||||||||||
Molybdenum Resources (1)(2) - December 31, 2024 | ||||||||||||||||||||||||||||||||||
|
| Measured Resource | Indicated Resource | Measured and Indicated Resource | Inferred Resource |
| ||||||||||||||||||||||||||||
Deposits/Districts | Newmont Share | Tonnage (000 tonnes) | Grade (Mo %) | Tonnes (3) (000) | Tonnage (000 tonnes) | Grade (Mo %) | Tonnes (3) (000) | Tonnage (000 tonnes) | Grade (Mo %) | Tonnes (3) (000) | Tonnage (000 tonnes) | Grade (Mo %) | Tonnes (3) (000) | Metallurgical Recovery (3) | ||||||||||||||||||||
Cadia, Australia | 100 | % | — | — | % | — | 1,173,900 | 0.01 | % | 100 | 1,173,900 | 0.01 | % | 100 | 509,600 | — | % | — | 72 | % | ||||||||||||||
NuevaUnión, Chile (4) | 50 | % | 159,500 | 0.01 | % | — | 231,500 | 0.01 | % | — | 391,000 | 0.01 | % | — | 362,300 | — | % | — | 52 | % | ||||||||||||||
Total Molybdenum |
| 159,500 | 0.01 | % | — | 1,405,400 | 0.01 | % | 100 | 1,564,900 | 0.01 | % | 100 | 872,000 | — | % | 100 | 62 | % | |||||||||||||||
____________________________ | ||
(1) | Resources are reported exclusive of reserves. | |
(2) | At December 31, 2025 and 2024, molybdenum resources at sites in which Newmont is the operator were estimated at a molybdenum price of $16 per pound, unless otherwise noted. Tonnage amounts have been rounded to the nearest 100,000. | |
(3) | Tonnes are estimates of metal contained in ore tonnages and do not include allowances for processing losses. Metallurgical recovery rates represent the estimated amount of metal to be recovered through metallurgical extraction processes. Tonnes may not recalculate as they are rounded to the nearest 100,000. | |
(4) | Project is currently undeveloped and is included in Corporate and Other in Note 4 to the Consolidated Financial Statements. Molybdenum resources at December 31, 2025 were estimated at a molybdenum price of $10.00 per pound. Molybdenum resources at December 31, 2025 and 2024 were provided by the NuevaUnión joint venture. | |
About Newmont
Newmont is the world’s leading gold company and a producer of copper, zinc, lead, and silver. The company’s world-class portfolio of assets, prospects and talent is anchored in favorable mining jurisdictions in Africa, Australia, Latin America & Caribbean, North America, and Papua New Guinea. Newmont is the only gold producer listed in the S&P 500 Index and is widely recognized for its principled environmental, social, and governance practices. Newmont is an industry leader in value creation, supported by robust safety standards, superior execution, and technical expertise. Founded in 1921, the company has been publicly traded since 1925. At Newmont, our purpose is to create value and improve lives through sustainable and responsible mining. To learn more about Newmont’s sustainability strategy and initiatives, go to www.newmont.com.
Cautionary Statement Regarding Reserve and Resource Estimates:
The reserves stated herein were prepared in compliance with Subpart 1300 of Regulation S-K adopted by the United States Securities and Exchanges Commission ("the SEC") and represent the amount of gold, copper, silver, lead, zinc, and molybdenum estimated, at December 31, 2025 or December 31, 2024, as applicable, could be economically and legally extracted or produced at the time of the reserve determination. The term “economically,” as used in this definition, means that profitable extraction or production has been established or analytically demonstrated in at a minimum, a pre-feasibility study to be viable and justifiable under reasonable investment and market assumptions. The term “legally,” as used in this definition, does not imply that all permits needed for mining and processing have been obtained or that other legal issues have been completely resolved. However, for a reserve to exist, Newmont (or our joint venture partners) must have a justifiable expectation, based on applicable laws and regulations, that issuance of permits or resolution of legal issues necessary for mining and processing at a particular deposit will be accomplished in the ordinary course and in a timeframe consistent with Newmont’s (or our joint venture partners') current mine plans. Reserves in this presentation are aggregated from the proven and probable classes. The term “Proven reserves” used in the tables of the appendix means reserves for which (a) quantity is estimated from dimensions revealed in outcrops, trenches, workings or drill holes; (b) grade and/or quality are estimated from the results of detailed sampling; and (c) the sites for inspection, sampling and measurements are spaced so closely and the geologic character is sufficiently defined that size, shape, depth and mineral content of reserves are well established. The term “Probable reserves” means reserves for which quantity and grade are estimated from information similar to that used for Proven reserves, but the sites for sampling are farther apart or are otherwise less closely spaced. The degree of assurance, although lower than that for Proven reserves, is high enough to assume continuity between points of observation. Newmont classifies all reserves as Probable on its development projects until a year of production has confirmed all assumptions made in the reserve estimates. Proven and Probable reserves include gold, copper, silver, zinc, lead, or molybdenum attributable to Newmont’s ownership or economic interest. Proven and Probable reserves were calculated using cut-off grades. The term “cutoff grade” means the lowest grade of mineralized material considered economic to process. Cut-off grades vary between deposits depending upon prevailing economic conditions, mineability of the deposit, by-products, amenability of the ore to gold, copper, silver, zinc, lead, or molybdenum extraction and type of milling or leaching facilities available.
Estimates of Proven and Probable reserves are subject to considerable uncertainty. Such estimates are, or will be, to a large extent, based on the prices of gold, silver, copper, zinc, lead, and molybdenum and interpretations of geologic data obtained from drill holes and other exploration techniques, which data may not necessarily be indicative of future results. If our reserve estimations are required to be revised using significantly lower gold, silver, zinc, copper, lead, and molybdenum prices as a result of a decrease in commodity prices, increases in operating costs, reductions in metallurgical recovery or other modifying factors, this could result in material write-downs of our investment in mining properties, goodwill and increased amortization, reclamation and closure charges. Producers use pre-feasibility and feasibility studies for undeveloped ore bodies to derive estimates of capital and operating costs based upon anticipated tonnage and grades of ore to be mined and processed, the predicted configuration of the ore body, expected recovery rates of metals from the ore, the costs of comparable facilities, the costs of operating and processing equipment and other factors. Actual operating and capital cost and economic returns on projects may differ significantly from original estimates. Further, it may take many years from the initial phases of exploration until commencement of production, during which time, the economic feasibility of production may change. Estimates of resources are subject to further exploration and development, are subject to additional risks, and no assurance can be given that they will eventually convert to future reserves. Inferred resources, in particular, have a great amount of uncertainty as to their existence and their economic and legal feasibility. Investors are cautioned not to assume that any part of all of the Inferred resource exists or is economically or legally mineable. The Company cannot be certain that any part or parts of the resource will ever be converted into reserves. In addition, if the price of gold, silver, copper, zinc, lead, or molybdenum declines from recent levels, if production costs increase, grades decline, recovery rates decrease or if applicable laws and regulations are adversely changed, the indicated level of recovery may not be realized or mineral reserves or resources might not be mined or processed profitably. If we determine that certain of our mineral reserves or resources have become uneconomic, this may ultimately lead to a reduction in our aggregate reported mineral reserves and resources. Consequently, if our actual mineral reserves and resources are less than current estimates, our business, prospects, results of operations and financial position may be materially impaired. For additional information see the “Proven and Probable Reserve" and "Measured and Indicated and Inferred Resource" tables herein.
Cautionary Statement Regarding Forward Looking Statements:
This release may contain “forward-looking statements” within the meaning of Section 27A of the Securities Act of 1933, as amended, and Section 21E of the Securities Exchange Act of 1934, as amended, which are intended to be covered by the safe harbor created by such sections and other applicable laws. Such forward-looking statements may include, without limitation, estimates and expectations of future production, reserve estimates, exploration outlook and expected expenditure, and operational and financial performance. Where a forward-looking statement expresses or implies an expectation or belief as to future events or results, such expectation or belief is expressed in good faith and believed to have a reasonable basis. However, such statements are subject to risks, uncertainties and other factors, which could cause actual results to differ materially from future results expressed, projected or implied by the forward-looking statements. Such assumptions, include, but are not limited to the key assumptions set forth on page 5 herein. Investors are also encouraged to refer to the Company’s Form 10-K filed with the U.S. Securities and Exchange Commission (the “SEC”) on or about February 19, 2026, under the heading “Risk Factors", as well as Newmont's other SEC filings, available on the SEC website or at www.newmont.com. Newmont does not undertake any obligation to release publicly revisions to any “forward-looking statement,” including, without limitation, outlook, to reflect events or circumstances after the date of this news release, or to reflect the occurrence of unanticipated events, except as may be required under applicable securities laws. Investors should not assume that any lack of update to a previously issued “forward-looking statement” constitutes a reaffirmation of that statement. Continued reliance on “forward-looking statements” is at investors’ own risk.
View source version on businesswire.com: https://www.businesswire.com/news/home/20260219894602/en/

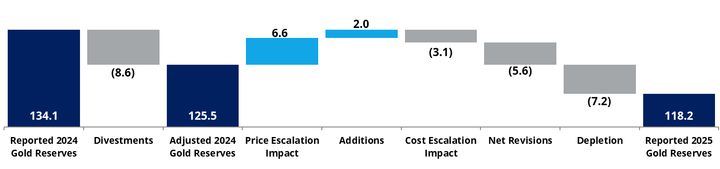
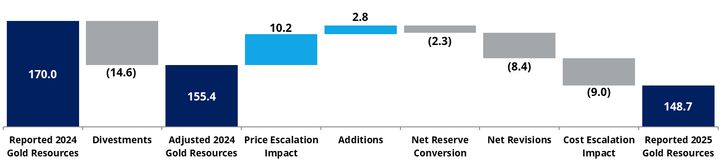
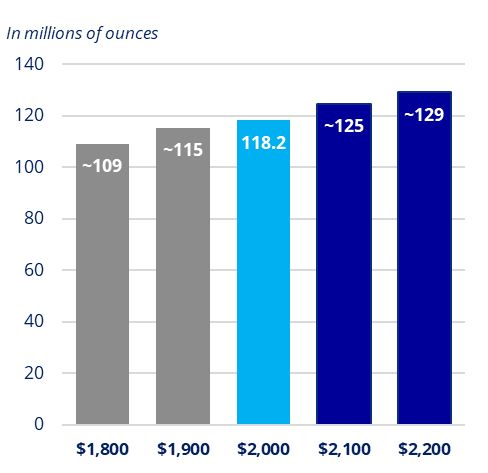
Subscribe to releases from Business Wire
Subscribe to all the latest releases from Business Wire by registering your e-mail address below. You can unsubscribe at any time.
Latest releases from Business Wire
Unveiling NVIDIA Solution Center: Grid Dynamics’ Family of AI Solutions to Cut Costs for Retail and Manufacturing19.2.2026 22:05:00 CET | Press release
Key Takeaways: Enables enterprises to replace high-cost and recurring SaaS licensing fees with high-performance and cost-efficient NVIDIA-based solutions Offerings are derived from Grid Dynamics’ proven customer solutions and leverage NVIDIA’s technology stack Commercially deployed, with additional customers expressing interest NVIDIA and Grid Dynamics jointly presented these solutions at the National Retail Federation (NRF) conference in January 2026 Learn more in NVIDIA’s published blog Grid Dynamics Holdings, Inc. (Nasdaq: GDYN) (Grid Dynamics), a premier AI transformation partner for the Fortune 1000, today announced the launch of its NVIDIA Solution Center. This suite of ready-to-deploy AI applications helps retail and manufacturing enterprises move away from costly, recurring SaaS licenses and subscription fees toward high-performance, NVIDIA-powered solutions. Learn more by reading NVIDIA’s recent announcement. The NVIDIA Solution Center is derived from Grid Dynamics’ proven suc
Rimini Street Announces Fiscal Fourth Quarter and Annual 2025 Financial and Operating Results19.2.2026 22:01:00 CET | Press release
Fourth Quarter and Full Year 2025 Financial Highlights Include:Remaining Performance Obligations (RPO) of $652.9 million, up 11.1% from the prior yearAdjusted Calculated Billings, full year 2025, up 4.2% from the prior yearAdjusted Annualized Recurring Revenue (ARR) up 3.1% from the prior year Rimini Street, Inc., (Nasdaq: RMNI), a global provider of end-to-end enterprise software support, managed services and Agentic AI ERP innovation solutions, and the leading third-party support provider for Oracle, SAP and VMware software, today announced results for the 2025 fourth quarter and fiscal year ended December 31, 2025. This press release features multimedia. View the full release here: https://www.businesswire.com/news/home/20260219293814/en/ Rimini Street Announces Fiscal Fourth Quarter and Annual 2025 Financial and Operating Results “Our fourth quarter results reflect solid execution and continued accelerating sales growth, adjusted for the Oracle PeopleSoft support and services wind
Ares Management Prices European Direct Lending CLO II at Over €300 Million19.2.2026 18:25:00 CET | Press release
Ares Management Corporation (NYSE: ARES) (“Ares”), a leading global alternative investment manager, announced today the pricing of its second European Direct Lending Collateralized Loan Obligation, Ares European Direct Lending CLO II (“EDL CLO II”), at over €300 million. Consistent with the underlying composition of its predecessor, EDL CLO II is a diversified CLO comprised entirely of directly originated and actively managed loans issued by over 70 middle-market companies predominantly based in Western Europe and primarily operating in resilient industries. The instrument is weighted towards senior-secured floating rate loans and will be rated by S&P and KBRA. Ares believes EDL CLO II is among the first multi-currency middle-market CLOs in Europe. “We are pleased to successfully price our second European Direct Lending CLO in less than 12 months as we continue building on our nearly 20 years of corporate direct lending experience in Europe,” said Michael Dennis, Partner and Co-Head of
Positive Phase 3 Data Demonstrate Potential for ENTYVIO® (vedolizumab) to Address Treatment Gap for Children and Adolescents with Moderate to Severe Ulcerative Colitis19.2.2026 18:00:00 CET | Press release
Pivotal Phase 3 global KEPLER study of vedolizumab intravenous (IV) in pediatric patients ages 2 to 17, who had an inadequate response to either conventional treatment options or tumor necrosis factor (TNF) antagonists, found nearly half (47.3%) of randomized patients achieved primary endpoint of clinical remission at 54 weeksVedolizumab’s safety profile was generally consistent with its known safety profile in adultsResults were presented at the 21st Congress of the European Crohn’s and Colitis Organisation (ECCO) Takeda (TSE:4502/NYSE:TAK) today announced positive data from the pivotal Phase 3 KEPLER trial, which demonstrated that ENTYVIO® (vedolizumab) can offer the possibility of clinical remission for patients ages 2 and older with moderately to severely active ulcerative colitis (UC), a chronic inflammatory disease of the gastrointestinal tract and one of the two most common types of inflammatory bowel disease.1,2 The results, presented at the 21st Congress of the European Crohn’
Andersen Consulting udvider sine kompetencer inden for data og analyse med Insight Consulting19.2.2026 17:06:00 CET | Pressemeddelelse
Andersen Consulting styrker sin platform gennem en samarbejdsaftale med Insight Consulting, der er en førende rådgivningsvirksomhed inden for data og digital strategi med tilstedeværelse i Sydafrika, Mozambique og Storbritannien. Insight Consulting tilbyder end-to-end-ydelser på tværs af den digitale værdikæde, herunder digital strategi, digital kompetenceudvikling, enterprise AI, skræddersyet softwareudvikling, dataintegration, analyse samt planlægning og forecasting. Virksomhedens tværfaglige teams kombinerer ekspertise inden for mennesker, teknologi og processer og sikrer, at effektiv forandringsledelse omfatter alle tre elementer. Virksomheden arbejder på tværs af brancher som detailhandel, logistik, oplevelsesbranchen, finans, fremstillingsindustrien, rejsebranchen, landbrug, transport og sundhed. "Samarbejdet med Andersen Consulting giver os adgang til et bredere globalt fodaftryk og avancerede metoder, samtidig med at vi kan bidrage med vores regionale indsigt og ekspertise inde
In our pressroom you can read all our latest releases, find our press contacts, images, documents and other relevant information about us.
Visit our pressroom